Download

1 / 1
10 likes | 103 Vues
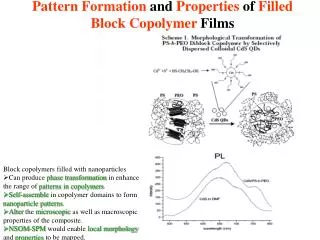
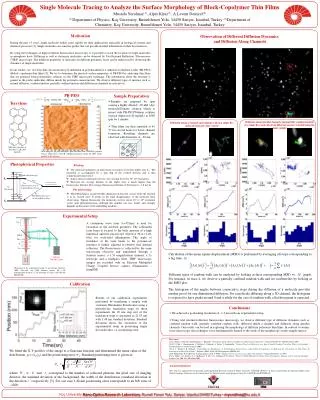
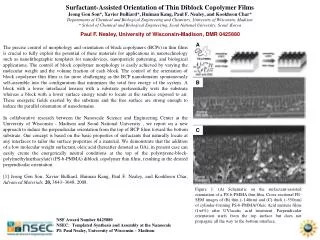
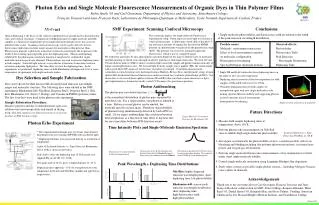
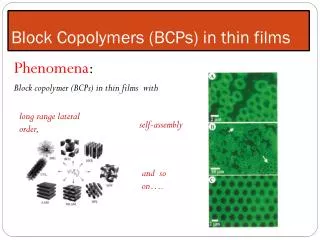
Analyzing polymer thin films using single molecule tracking to understand surface properties through fluorescence microscopy. Experiment setup, photophysical properties, and surface morphology evaluation discussed.

E N D
CH2 CH = = = CH CH2 CH2 CH2 O b m n (163000g/mol) (32000g/mol) 1 2 1 3 4 2 Internal conversion (ps) S1 kISC kFL Fluorescence (ns-ms) or non-radiative decay T1 huExcitation kT Phosphorescence (ms-s) or non-radiative decay S0 O DM M T F 532 nm Nd:YAG Laser CCD camera We fitted the X-Y profiles of the image to a Gaussian function and determined the mean value of the distribution, m = (xo,yo) and the positioning error .Standard positioning error is given as; PB PB PB PB PB PB PEO where , , and correspond to the number of collected photons, the pixel size of imaging detector, the standard deviation of the background, the width of the distribution (standard deviation in the direction, ) respectively [5]. For our case 1.48 nm positioning error corresponds to an N/b ratio of ~1200. Single Molecule Tracing to Analyze the Surface Morphology of Block-Copolymer Thin Films Mustafa Yorulmaz(1), Alper Kiraz(1), A.Levent Demirel(2) (1)Department of Physics, Koç University, Rumelifeneri Yolu, 34450 Sariyer, Istanbul, Turkey (2)Department of Chemistry, Koç University, Rumelifeneri Yolu, 34450 Sariyer, Istanbul, Turkey Motivation Observation of Different Diffusion Dynamics and Diffusion Along Channels During the past 15 years, single molecule studies grew rapidly for their applications especially in biological systems and chemical processes [1]. Single molecules are sensitive probes that can provide detailed information on their host matrices. By using the techniques of high resolution fluorescence microscopy, it is possible to track the location of single molecules in amorphous hosts. Diffusing as well as stationary molecules can be observed by Total Internal Reflection Fluorescence (TIRF) microscopy. The diffusion properties of molecules in different polymeric hosts can be understood by observing the dynamics of single molecules. In our studies, we use Terrylene dye molecules [2] embedded in poly(butadiene(1,4 addition)-b-ethylene oxide) (PB-PEO) diblock copolymer thin films [3]. We try to determine the physical surface properties of PB-PEO by analyzing thin films that are prepared from polymer/dye solution via the TIRF microscopy technique. The information about the structure is gained as the probe molecules diffuse inside the polymeric nanostructure. We observe different types of motions such as normal diffusion, confined motion, partially confined motion and diffusion in channels in each movie. PB-PEO Sample Preparation • Samples are prepared by spin coating a highly diluted (~20 nM ) dye molecule/Toluene solution which is mixed with PB-PEO/Toluene solution (typical dispersion 40 mg/mL) at 2000 rpm for 1 minute. • Thin films are then annealed at 65 C for several hours for better channel formation. Resulting channels are observed with diameters of ~30 nm. Terrylene Diffusion along parallel channels and partially confined motion of a single dye molecule from different movies recorded using the same sample Diffusion along a channel and random walk of a single dye molecule from the above movie Molecular structure of Terrylene (C30H16)dye molecule AFM image of the poly(butadiene)-poly(ethylene oxide) (PB-PEO) polymer surface which shows the PB cylindrical channels inside the PEO matrix parallel to the substrate. Photophysical Properties Blinking • The molecule undergoes an intersystem crossing to its lowest triplet state T1. The transition is accompanied by a spin flip of the excited electron and is thus symmetrically disfavored. • Intersystem crossing rates are low, one crossing for every 105-106 excitations. • However the average lifetime of the triplet state is much higher than the fluorescence lifetime. The average fluorescence lifetime of Terrylene is ~3.8 ns [4]. Photobleaching • Photobleaching is an irreversible chemical reaction that occurs while the electronis in its excited state.It results in the final disappearanceof the moleculefrom observation. Typical fluorescentdye molecules survive about 105to106 excitation cycles until photodestruction,although thisnumber can vary widely andstrongly depends on the natureof the embedding medium. Experimental Setup A continuous wave laser (l=532nm) is used for excitation in the inverted geometry. The collimated laser beam is focused to the back aperture of a high numerical aperture microscope objective (N.A.=1.49, 60x) for wide-field illumination. The angle of incidence of the laser beam to the polymer-air interface is further adjusted to observe total internal reflection. The fluorescence is collected by the same microscope objective and transmitted through a dichroic mirror, a 1.5x magnification element, a 2x telescope and a bandpass filter. TIRF microscopy images are recorded with an Electron Multiplied Charge Coupled Device camera (Hamamatsu – ImagEM). Calculation of the mean square displacement (MSD) is performed by averaging all steps corresponding to a lag time ; Illustration of the experimental setup. O, microscope objective (60X, NA=1,49, oil); DM, dichroic mirror; M, 1.5X magnification element; T, 2X telescope; F, filters (LP 550 and HQ 605/90). Different types of random walk can be analyzed by looking at their corresponding MSD vs. graph. For instance, in trace 4, we observe a partially confined random walk and we confirm this by looking at the MSD plot. Calibration The histogram of the angles between consecutive steps during the diffusion of a molecule provides another proof for one dimensional diffusion. For a molecule diffusing along a 1D channel, the histogram is expected to have peaks around 0 and p while for the case of random walk a flat histogram is expected. Results of our calibration experiments performed by translating a sample with stationary Rhodamine B molecules using a piezoelectric translation stage. In these experiments the 20 nm step size of the translation stage is measured as 21.83 nm with 1.48 nm standard deviation. Standard deviation shows the resolution of the experimental setup in positioning single dye molecules, i.e. positioning error. Conclusions • We achieved a positioning resolution of ~1.5 nm with our experimental setup. • Using total internal reflection fluorescence microscopy, we observe different type of diffusion dynamics such as confined random walk, partially confined random walk, diffusion inside a channel and diffusion along parallel channels. Our results can be used in exploring the morphology of different polymeric thin films. In contrast to atomic force microscopy, this technique is not fundamentally limited to the study of the morphology on the sample surface. References: [1] A. Zürner, J. Kirstein, M. Döblinger, C. Brauchle, “Visualizing Single-Molecule Diffusion in Mesoporous Materials”, Nature/Vol.450, No: 705/ November 2007 [2] R. J. Pfab, J. Zimmermann, C. Hettich, I. Gerhardt, A. Renn, V. Sandoghdar, “Aligned Terrylene Molecules in a Spin Coated Ultrathin Crystalline Film of p-Terphenyl”, Chemical Physics Letters/ January 2004. [3] A. L. Demirel, H. Schlaad, “Controlling the Morphology of Polybutadiene-Poly(ethylene oxide) Diblock Copolymers in Bulk and the Orientation in Thin Films by Attachment of Alkyl Side Chains”, Polymer (2008), DOI: 10.1016/j.polymer.2008.05.041. [4] T. Plakhotnik, W. E. Moerner, T. Irngartinger, and U. P. Wild, “Single molecule spectroscopy in Shpol'skii matrixes” Chimia/Vol.48 No: 31/1994 [5] A. Yildiz, J. N. Forkey, S. A. McKinney, T. Ha, Y. E. Goldman, P. R. Selvin, “Myosin V Walks Hand-Over-Hand: Single Fluorophore Imaging with 1.5-nm Localization”, Science/ Vol. 300, No: 2061/June 2003 Acknowledgements: This work was supported by the Scientific and Technological Research Council of Turkey (Grant No. TÜBİTAK-107T211). A. Kiraz acknowledges the financial support of the Turkish Academy of Sciences in the framework of the Young Scientist Award program (Grant No. A.K/TÜBA-GEBİP/2006-19). Koç UniversityNano-Optics Research Laboratory, Rumeli Feneri Yolu, Sariyer, Istanbul 34450 Turkey • myorulmaz@ku.edu.tr