CHE 333 Class 4
CHE 333 Class 4. Phase Diagrams. Why Phases?. Few materials used in pure state – gold, copper, platinum etc for electrical properties or coatings.

CHE 333 Class 4
E N D
Presentation Transcript
CHE 333 Class 4 Phase Diagrams.
Why Phases? • Few materials used in pure state – gold, copper, platinum etc for electrical properties or coatings. • Most materials consist of mixtures of elements. Can be two, or a binary system that then has two components. Brass is a mixture of copper and zinc in a binary two component system. Another is steel which is a binary system of carbon and iron. • Mixtures of more are called ternary systems or quarternary systems, with three and four elements or components in them. Best example of a ternary system is stainless steels, containing iron, chromium and nickel. • Phases present control the “microstructure” of a material, which affects the chemical and physical properties.
PHASES • Familiarity with phases exists. • H2O system • Ice – solid – below 0C, water – liquid 0 to 100C, steam – vapor- above 100C. • So COMPOSITION and TEMPERATURE important. • Engineers need to control phases for CONSTANT PROPERTIES. • Usually no phase change in service. • No transformation from solid to liquid. • Manufacturing may use phase changes for example casting, soldering, hardened steel, injection molding, slip casting.
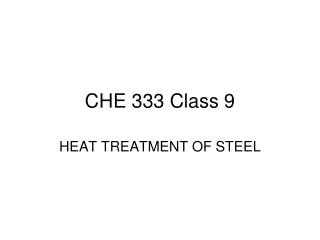
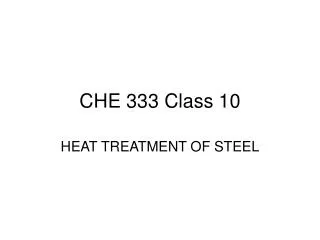
Copper Nickel Phase Diagram Phase Changes – Pure copper goes from solid to liquid at its melting point of 1084C. Pure nickel goes from solid to liquid at its melting point of 1455C. These are singular points in that all solid goes to all liquid at a unique temperature. Therefore on the phase diagram they can be represented by a single point. What happens in between?
Add copper to nickel, say 47 gms of copper and 53 gms of nickel. This is then the “average composition”. If this block of material is analyzed it will show 47 gms of copper and 53 gms of nickel. What happens on heating . The phase diagram is a map of the phases present. Up to 1275C solid solution a is present which is a mixture of copper in nickel. At 1275 the dashed line showing the composition intersects a curved line joining the two single melting points. This line is called the solidus line and represents a phase boundary where solid a changes to two phases of solid a +liquid. Some of the a has melted. Below the solidus only one phase is present so the copper is completely soluble in the nickel or complete solid solubility
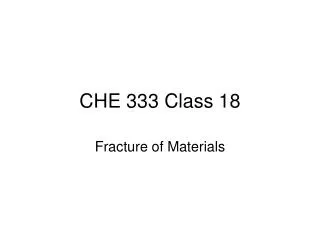
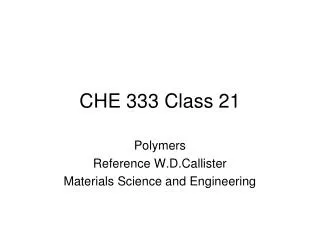
Lead Tin Phase Diagram- Eutectic Consider a 90%Pb10%Sn average composition at 330C, it will be all liquid. At 300C it will have crossed the liquidus and so will be a mixture of solid and liquid. At 275 it will cross the solidus and become a single phase a solid. As the temperature decreases, another phase boundary occurs, the solvus where a second new solid phase forms, so at room temperature two solid phases, a and b exist. In This case, tin has limited solid solubilty in lead at room temperature as shown by the presence of the solvus lines.
Consider the composition of 61.9% Sn38.9% Pb At 250c it is all liquid and at 182C it is all solid but with two phases, a and b, present. At 183C all the liquid goes to all solid, but the solid is in two phases. This is called a “Eutectic” reaction. Liquid Solid 1 + Solid 2.
Compositions in Two Phases • Draw in horizontal temperature line at specified temperature, 1300c • Draw in vertical average composition line, 53%Ni 47%Cu. • Extend horizontal “tie line” to intersect both liquidus and solidus at the temperature. • Intersection of temperature line with liquidus is the composition of the liquid in the two phase region • at the temperature, 45%Ni 55% Cu, different from the average. • Intersection of the temperature line with the solidus is the solid composition in the two phase region • 58%Ni 42%Cu. • 6. The composition at a fixed temperature in a two phase region is where the temperature intersects • the respective phase boundaries. So the boundaries provide the composition in two phase regions
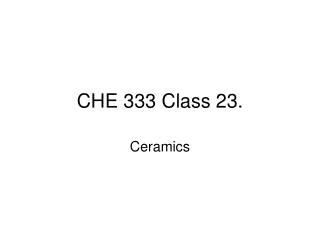
Eutectic Phase Change Consider composition 60%Pb 40% Sn. At temperature a, it is all solid; at b some solid will form and at c it is clearly in a two phase solid a + liquid region. The solid will have a composition which follows the solidus while the liquid will have a composition that follows the liquidus. So at 183C any liquid remaining will have the eutectic composition and will become solid of two phases a and b. On further cooling the solid a and b will follow the solvus lines for their phases for composition. At room temperature there will be two phases, a and b.