Download
1 / 2
20 likes | 100 Vues
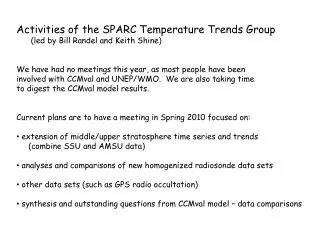
The SPARC Temperature Trends Group led by Bill Randel and Keith Shine is focused on analyzing and comparing temperature data sets, planning a meeting in Spring 2010 to extend stratosphere time series, and addressing outstanding questions from CCMval models. The group will combine SSU and AMSU data for analyses and synthesis, including comparing model results with satellite data. Bill Randel has highlighted concerns about the SSU26 data channel and calls for independent review. The group will also attend the NOAA meeting on climate data quality next March.

E N D
Activities of the SPARC Temperature Trends Group • (led by Bill Randel and Keith Shine) • We have had no meetings this year, as most people have been • involved with CCMval and UNEP/WMO. We are also taking time • to digest the CCMval model results. • Current plans are to have a meeting in Spring 2010 focused on: • extension of middle/upper stratosphere time series and trends • (combine SSU and AMSU data) • analyses and comparisons of new homogenized radiosonde data sets • other data sets (such as GPS radio occultation) • synthesis and outstanding questions from CCMval model – data comparisons
Example of temperature time series comparisons with CCMval models. Black lines show global temperature anomalies from SSU and MSU satellite data for 1979-2005; colored lines are corresponding model results. Bill says: My suspicion is on the SSU26 data. I have always been worried about this channel, as the time series looks funny at the end (in comparison with all the other channels). The comparisons with models brings this out more clearly, especially as all the other channels match pretty well. I think what is needed is for an independent group to look into the SSU data sets. Note there is a NOAA meeting on constructing climate quality data from MSU, SSU and AMSU data next March, that a few of us SPARC folks will attend.