LESSON 19: INVENTORY MODELS (STOCHASTIC) Q , R SYSTEMS OPTIMIZATION WITH SERVICE
210 likes | 544 Vues
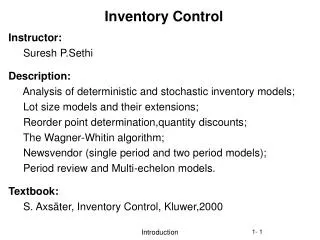
LESSON 19: INVENTORY MODELS (STOCHASTIC) Q , R SYSTEMS OPTIMIZATION WITH SERVICE. Outline Multi-Period Models Lot size-Reorder Point ( Q , R ) Systems Optimization with service Procedure for Type 1 Service Procedure for Type 2 Service Example. Optimization With Service.

LESSON 19: INVENTORY MODELS (STOCHASTIC) Q , R SYSTEMS OPTIMIZATION WITH SERVICE
E N D
Presentation Transcript
LESSON 19: INVENTORY MODELS (STOCHASTIC)Q,R SYSTEMSOPTIMIZATION WITH SERVICE Outline • Multi-Period Models • Lot size-Reorder Point (Q, R) Systems • Optimization with service • Procedure for Type 1 Service • Procedure for Type 2 Service • Example
Optimization With Service • In Lesson 18, we discuss the procedure of finding an optimal Q, R policy without any service constraint and using a stock-out penalty cost of p per unit. • Managers often have difficulties to estimate p. • A substitute for stock-out penalty cost, p. is service level. • In this lesson we shall not use stock-out penalty cost, p. Instead , we shall assume that a service level must be met. Next slide defines two major types of service levels.
Optimization With Service • Type 1 service • The probability of not stocking out during the lead time is denoted by . In problems with Type 1 service, is specified e.g., = 0.95 • Type 2 service • Fill rate, : The proportion of demands that are met from stock is called filled rate and is denoted by . In problems with Type 2 service, is specified e.g., = 0.999
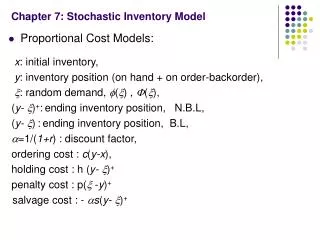
Procedure to Find the Optimal (Q,R) Policy with Type 1 Service Goal: Given find (Q,R) to minimize total cost First, find mean of the lead-time demand, and standard deviation of the lead-time demand, Step 1: Set Q = EOQ Step 2: Find zfor which area on the left, F(z) = Step 3: Find R =
Procedure to Find the Optimal (Q,R) Policy with Type 2 Service Goal: Given find (Q,R) to minimize total cost First, find mean of the lead-time demand, and standard deviation of the lead-time demand, Step 1: Take a trial value of Q = EOQ Step 2: Find expected number of shortages per cycle, standardized loss function, and the standard normal variate z from Table A-4, pp. 835-841. Find a trial value of R=
Procedure to Find the Optimal (Q,R) Policy with Type 2 Service Step 3: Find area on the right, 1-F(z) from Table A-1 or A-4, pp. 835-841 Step 4: Find the modified Step 5: Find expected number of shortages per cycle, standardized loss function, and the standard normal variate z from Table A-4, pp. 835-841. Find the modified R= Step 6: If any of modified Qand R is different from the previous value, go to Step 3. Else if none of Qand R is modified significantly, stop.
Example - Optimal (Q,R) Policy with Service Annual demand for number 2 pencils at the campus store is normally distributed with mean 2,000 and standard deviation 300. The store purchases the pencils for 10 cents and sells them for 35 cents each. There is a two-month lead time from the initiation to the receipt of an order. The store accountant estimates that the cost in employee time for performing the necessary paper work to initiate and receive an order is $20, and recommends a 25 percent annual interest rate for determining holding cost.
Example - Optimal (Q,R) Policy with Service a. Find an optimal (Q,R) policy with Type 1 service, =0.95 and Q=EOQ b. Find an optimal (Q,R) policy with Type 2 service, =0.999 and using the iterative procedure
Example - Optimal (Q,R) Policy with Service a. Type 1 service, = 0.95 Step 1. Q = EOQ = Step 2. Find zfor which area on the left, F(z) = = 0.95 Step 3. R = b. Type 2 service, =0.999 This part is solved with the iterative procedure as shown next.
Example - Optimal (Q,R) Policy with Service Iteration 2
(Q,R) Systems Remark • We solve three versions of the problem of finding an optimal (Q,R) policy • No service constraint • Type 1 service • Type 2 service • All these versions may alternatively and more efficiently solved by Excel Solver. This is discussed during the tutorial.
Multiproduct Systems • Pareto effect • A concept of economics applies to inventory systems • Rank the items in decreasing order of revenue generated • Item group A: top 20% items generate 80% revenue • Item group B: next 30% items generate 15% revenue • Item group A: last 50% items generate 5% revenue
Multiproduct Systems • Exchange curves • Parameters like K and I are not easy to measure • Instead of assigning values to such parameters show the trade off between holding cost and ordering cost for a large number of values of K/I • The effect of changing the ratio K/I is shown by plotting holding cost vs ordering cost • Similarly, instead of assigning a value to type 2 service level , one may show the trade off between cost of safety stock and expected number of stock-outs.
READING AND EXERCISES Lesson 19 Reading: Section 5.5, pp. 264-271 (4th Ed.), pp. 255-262 (5th Ed.) Section 5.7 (skim) pp. 275-280 (4th Ed.), pp. 265-270 (5th Ed.) Exercise: 16 and 17, p. 271 (4th Ed.), p. 262 (5th Ed.)