The Chesapeake Bay
The Chesapeake Bay. The Chesapeake Bay by the Numbers. The watershed includes parts of six states and the District of Columbia, with headwaters in Cooperstown, New York. The Susquehanna River is the source of 45 percent of the Bay’s fresh water.


The Chesapeake Bay
E N D
Presentation Transcript
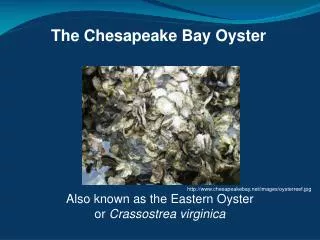
The Chesapeake Bay by the Numbers • The watershed includes parts of six states and the District of Columbia, with headwaters in Cooperstown, New York. • The Susquehanna River is the source of 45 percent of the Bay’s fresh water. • The Chesapeake Bay estuary is 195 miles long and from four to thirty miles wide, with a shallow average depth of only 22 feet. • The Bay is home to more than 2,700 plant and animal species.
The Chesapeake Bay by the Numbers • Approximately 17 million people live in the watershed; about 10 million people live along its shores or near them. • Formed about 12,000 years ago as glaciers melted and flooded the Susquehanna River valley, the Chesapeake Bay is North America's largest estuary and the world's third largest. • The narrowest part of the Bay, near Aberdeen, MD, is about 3.5 miles. The widest point - from Smith Point, VA, to Virginia's Eastern Shore - is 30 miles. • The Bay is home to more than 2,700 plant and animal species.
Threats • The bay suffers from persistent eutrophication as a result of excessive anthropogentic nutrient loads entering its watershed • The leading threat to the health of the Chesapeake Bay is excess nitrogen and phosphorus pollution that destroys habitat and causes fish kills. • Top sources of these pollutants include agriculture, sewage treatment plants, runoff from urban and suburban areas, and air pollution from automobiles, factories, and power plants. • Other threats to the Bay's health include sprawl, toxic pollution, and poor fishery management. • According to the CBF's 2008 State of the Bay Report the Bay's health rates a 28 out of 100 (a "pristine" Bay circa. 1600). At its worst in the early 1980s, the Bay would have scored a 23. A "saved Bay" would score a 70.
With rain feeding runoff pollution, and with summer temperatures in the 90s, algae blooms such as this one near the Hampton Roads Bridge Tunnel are crop up in waters in the Chesapeake Bay.
Natural Filters Lost • Forests: once 95% of LC now only a fraction of historical cover. ½ of shoreline forest lost. • Wetlands: 2 of the 3.5 million historical acres lost or degraded • Bay grasses or SAV(Submerged Aquatic Vegetation) only 13% of historical cover • 98% of oysters lost • These losses reduce the natural capacity of the environment to minimize (~90%) the impact of nutrient and pollution runoff into the bay.
Development Sustainable? • From 1990-2000 in the six Bay states and the District of Columbia, there was a 41% increase in impervious surfaces (roads, rooftops, and parking lots) but only an 8% increase in population. • What’s going on?
By the time the imperviousness of its local watershed reaches 20-25%, a stream is virtually devoid of complex life and, depending upon local conditions, may be either “dead” or nearly so. Center for Watershed Protection
Urban growth in Washington DC, 1986-2000These images were derived from Landsat data fitted with an algorithm that illuminates changes in low-density residential land use, exemplifying sprawl. Impervious surfaces are shown in yellow, orange, and red.
Changing Demographics What does this mean for the future?
Best Practices • Compact housing and building design • Preserve natural areas • Limit impervious surfaces • Mimic natural storm water infiltration • Pervious parking areas where possible • Design buildings to reuse/harvest rainwater • Encourage pedestrian and bicycle access • Mixed use development • Urbane community development • Look to the past to plan the future
MD Department of the Environment • Chesapeake Bay Restoration Act • Far-reaching legislation signed into law in 2004 to address Bay restoration, the Chesapeake Bay Restoration Fund, created a dedicated fund administered by MDE for upgrading the 66 largest wastewater treatment plants to Enhanced Nutrient Reduction (ENR) standards. • A nominal environmental surcharge is set on homeowners and businesses in Maryland to fund these upgrades
More Legislation • Maryland's Stormwater Management Act of 2007 • Effective on October 1, 2007. Regulations took effect on May 4, 2009 that require environmental site design (ESD), through the use of nonstructural best management practices and other better site design techniques • Regulations and General Permit for Animal Feeding Operations (AFO) • Once finalized, the regulations and permit are designed to control nutrients from Maryland’s largest agricultural animal operations • Maryland Clean Cars Program • The Maryland Clean Cars Program adopts California’s stricter vehicle emission standards. These standards will become effective in Maryland for model year 2011 vehicles, significantly reducing a number of emissions including volatile organic compounds (VOCs) and nitrogen oxides (NOx).
More Legislation • The Maryland General Assembly passed the Greenhouse Gas Reduction Act of 2009 • This legislation bill requires the State to achieve a 25 percent reduction in Statewide greenhouse gas (GHG) emissions from 2006 levels by 2020. • Policy for Nutrient Cap Management and Trading • The Maryland Department of the Environment (MDE) has developed a Policy for Nutrient Cap Management and Trading. • Maryland Healthy Air Act • One-third of the nitrogen delivered to the Bay comes from the air. • Maryland’s Healthy Air Act will have a significant benefit on public health, air quality and the health of the Chesapeake Bay. The emission controls will reduce air deposition of nitrogen by 900,000 pounds a year to the Bay. • Maryland Addresses Climate Change • In April 20, 2007, Governor Martin O’Malley signed Executive Order 01.01.2007.07 establishing the Maryland Climate Change Commission (MCCC) charged with collectively developing an action plan to address the causes of climate change, prepare for the likely consequences and impacts of climate change to Maryland