DNASIS MAX 2.0 Sequence Analysis Software
A comprehensive software for DNA and amino acid sequence analysis. Features include data entry, sequence manipulation, contig management, customization options, and access to external databases. Organize, analyze, and visualize genetic information efficiently.

DNASIS MAX 2.0 Sequence Analysis Software
E N D
Presentation Transcript
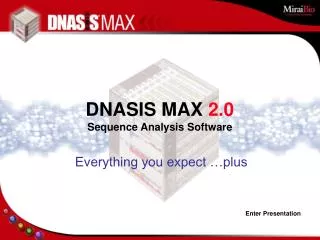
DNASIS MAX 2.0Sequence Analysis Software Everything you expect …plus Enter Presentation
Table of Contents • Main Analysis Window • Data Entry • Sequence Analysis • Contig Manager • Customization
The top tool bar is a standard Windows style menu with functions accessed from pull-down menus. Icon activation on this bar allows the user to modify the window presentation, set internet connectivity, copy and paste images, move data within the window, and print results. The left hand tool bar is the analytical core of DNASIS MAX. A series of expandable tabs representing DNA and amino acid sequence search, compare, and multiple sequence options are shown. Various manipulations are enabled by each tab. Select a tab to view it’s expanded menu. The Database tab connects to the correct storage location. The Options tab enables access to other modules in the DNASIS MAX suite including Contig Manager for assembly and DNASpace for automation functions. Main Window Data Entry Sequence Analysis Contig Manager Customization
The top two icons represent DNA and amino acid sequence. The type of sequence to be entered is designated by selecting the appropriate icon. The right hand tool bar will activate various aspects of the data in the current files. A pop up tool tip will identify each icon. Main Window Data Entry Sequence Analysis Contig Manager Customization
The Trace View view icon will display DNA sequence files with associated chromatographic data. This icon will be inactive (grayed out) when trace data is not available. Main Window Data Entry Sequence Analysis Contig Manager Customization
The Alignment icon toggles the graphical view of the sequence alignment and corresponding annotations. Main Window Data Entry Sequence Analysis Contig Manager Customization
The Analysis View icon toggles on and off and maximize the analysis view. Main Window Data Entry Sequence Analysis Contig Manager Customization
The Comment View icon represents the comment pane at the top of the analysis window. The Map View icon toggles the map pane. The Sequence View icon toggles the DNA or amino acid sequence. Main Window Data Entry Sequence Analysis Contig Manager Customization
The Data List icon will bring up a separate window displaying information about all operations performed. The results of any analysis that open in a window besides the main analysis window - e.g. multiple alignments - can be brought into view from this window. Analyses can be deleted, without maintaining the previous results, if re-analysis with different parameters is desired. Main Window Data Entry Sequence Analysis Contig Manager Customization
DNASIS MAX allows the organization of DNA and amino acid sequences, and other information concerning biological molecules into standard categories - such as vector sequences, DNA or protein motifs - as well as user defined categories. BLAST search results can also be stored. Selected preset database options are shown at the left side of the analysis window when the Database tab is active. Data is entered through the DNASIS MAX Entrez search function or by dragging and dropping any fasta formatted file. Other acceptable formats include Genbank flat file, EMBL, PIR and ABI or SCF sequence trace files. Main Window Data Entry Sequence Analysis Contig Manager Customization
To access the Parameterset Editor for database selection: position the mouse over the database of choice, right click on the selected category, highlight the desired database, and click ok. Subsequent molecules are registered to the desired database folder when the database type button is clicked. Main Window Data Entry Sequence Analysis Contig Manager Customization
In addition to user definable in-house DNA and amino acid databases, DNASIS MAX is preloaded with a PIR based database with over 50,000 amino acid sequences. Full access to NCBI through a built-in Entrez search function is also provided. Main Window Data Entry Sequence Analysis Contig Manager Customization
The default database URL is for NCBI Entrez. Additional web-source data can be used by clicking the Options button. Choose a keyword and database type to search. Keyword search options include the number of entries to retrieve and the modification date. Main Window Data Entry Sequence Analysis Contig Manager Customization
Retrieved records from the search are displayed in a separate window. Highlight preferred records and click the GenBank report button to see the full record. Main Window Data Entry Sequence Analysis Contig Manager Customization
Upon opening a text record, the comments pane of the main analysis window automatically opens. Map and Sequence panes display all sequence and annotation information. Main Window Data Entry Sequence Analysis Contig Manager Customization
By selecting this icon on the right-hand tool bar, the complete list of imported sequences are shown. All analyses performed on this file can also be shown or hidden in this window. Main Window Data Entry Sequence Analysis Contig Manager Customization
Enter one or more sequences into a new file by dragging and dropping into the sequence pane. Multiple sequences can be imported in batch by selecting in fasta format. Main Window Data Entry Sequence Analysis Contig Manager Customization
Imported DNA sequence are shown with no annotations or comments other than the basic header in Map View. Importing the same file in Genbank format would populate these fields more fully. Main Window Data Entry Sequence Analysis Contig Manager Customization
Select DNA Basic to perform simple manipulations of the sequence including complement, reverse, translate, base usage, and GC content. A single click will run the tool. Position the mouse over the icon to highlight and access the right click menu. To perform vector similarity based trimming, right click on “trimming” after highlighting the icon to set the parameters. To perform analyses, select a sequence in the sequence pane by clicking anywhere on the sequence. Main Window Data Entry Sequence Analysis Contig Manager Customization Customization
Click on the Codon Usage icon to display results. Only the codon usage table will appear in a separate window. All other analyses will be visible in the main analysis window. Main Window Data Entry Sequence Analysis Contig Manager Customization
From the DNA Search tab, perform multiple tasks including ORF analyses, primer and oligo design, creation of restriction maps, and motif and mutation searching . Main Window Data Entry Sequence Analysis Contig Manager Customization
From DNA Compare, run BLAST or Smith Waterman searches by highlighting the database and right clicking to activate the Parameterset Editor. Main Window Data Entry Sequence Analysis Contig Manager Customization
To search against an internal database, activate the Parameterset Editor. The resulting BLAST view can re-accessed from the analysis list. Main Window Data Entry Sequence Analysis Contig Manager Customization
Cluster sequences within a file or against other sequences in a pre-selected database. Main Window Data Entry Sequence Analysis Contig Manager Customization
In this example, the functions of the amino acid tabs are inactive (grayed-out) because no amino acid sequence is available. Select the NH icon from the right hand menu to import sequences and activate the appropriate functions. Main Window Data Entry Sequence Analysis Contig Manager Customization
Upon adding an amino acid sequence to the correct pane, all analysis functions become active. Both amino acid content and isoelectric point analysis will open in a separate window. Secondary structure will appear in the main analysis window. Main Window Data Entry Sequence Analysis Contig Manager Customization
Homology search viewer BLAST your sequence internally, via NCBI, or other internet - accessible databases by setting the URL in the parameter set editor. Alternatively, run a highly sensitive Smith Waterman search on a smaller database for faster results. Main Window Data Entry Sequence Analysis Contig Manager Customization
To create a new project, name the file and click new. When Contig Manager is launched, a project dialog window will appear. From this window, create a new project or open an existing one. DNASIS MAX manages all fragment data, quality values, trimming, and assembly results. Main Window Data Entry Sequence Analysis Contig Manager Customization
When the main Contig Manager window appears, add fragment sequences by highlighting trace files and dragging and dropping into the root folder. Contig Manager can read trace files as well as GenBank flat files, fasta files, multi fasta format files, and text files. The Import Summary dialog window will show imported data as well as any errors or skipped sequences noted. Main Window Data Entry Sequence Analysis Contig Manager Customization
For basecalling and assembly tasks, select all fragments on the list and click the “Auto Assemble” button. When the analysis is completed, the contig information is added to the Tree View. In the List View, the trimming and assembly results are added to each fragment. Main Window Data Entry Sequence Analysis Contig Manager Customization
When you select any contig in the Tree View, all fragments used to assemble the select contig - as well as associated information - will appear in the List View. Details can be seen in the fragment map by clicking on “Contig1”in the tree view. The Map View shows the entire picture of the contig graphically. This cursor (red rectangle) will magnify sequences in that area. Main Window The Sequence View shows the contig and fragment sequences. Data Entry Sequence Analysis Contig Manager Customization
The bars shown in the Map View designate individual fragments. The bar graph at the top reflects qualities of the contig sequence. Orange arrows indicate a complementary connection Blue arrows indicate normal assembly In the Sequence View, differences between the consensus sequence and the fragment are indicated. A yellow background on the consensus sequence indicates a mismatch, a lower case base indicates low quality, and an ‘N’ at the 5 prime or 3 prime end indicates a trimmed sequence. Main Window Data Entry Sequence Analysis Contig Manager Customization
To view trace data, highlight a base pair on the consensus sequence and click the Trace View icon. Each Trace View automatically scrolls to center the highlighted position. The bar graph shows quality values. Red indicates a higher quality while green shows a lower quality than the user-defined threshold. Main Window Data Entry Sequence Analysis Contig Manager Customization
The ability to set personalized analysis buttons for commonly used functions and view results in multiple formats eliminates tedious repetitive analyses and creates a flexible work environment. Main Window Data Entry Sequence Analysis Contig Manager Customization
The choice between proprietary and industry standard algorithms for basecalling and assembly facilitates import/export functions, speeds alignments, and provides measures for quality. Main Window Data Entry Sequence Analysis Contig Manager Customization
Perl scripting capability in the open Application Programming Interface (API) enables definable custom analyses and navigation for a prioritized workflow. Main Window Data Entry Sequence Analysis Contig Manager Customization
Features: • Blast search sample sequences to GenBank via NCBI web site and chose entries • Retrieve sequence, organism, and strain information from NCBI • Perform multiple alignments and create the phylogenic tree • Customization: • Custom analysis buttons and functions via DNASpace • Custom viewer via Perl scripting Example 1: Identify microorganism by phylogenic tree of 16 rRNA Main Window Data Entry Sequence Analysis Contig Manager Customization
Import EST Check EXON Edge Calc Specific Region Blast to Mouse Genome Output Results Primer Design Clear All Exec All View Exit • Features: • Import thousands of EST sequences • Design specific primers for an EST sequence with consistent Tm and percent GC • View results graphically with sequence and annotations including exon/intron data • Customization: • Custom analysis buttons and functions via DNASpace • Custom method via Perl scripting • Collaborate with MS-Access database Example 2: Design specific PCR primers Primer Viewer Main Menu by MS-Access Main Window Data Entry Sequence Analysis Contig Manager Customization
Cluster list viewer by MS-Access Example 3: EST Clustering • Features: • Process thousands of trace files, basecall, and calculate QV by phred • Trim vector and low quality sequences • Qualitative clustering with homology and precise clustering with phrap • Add annotations via BLAST of public database and view results • Customization: • Custom analysis buttons and functions via DNASpace • Custom method by Perl scripting • Collaborate with MS-Access database Contig Viewer Main Window Data Entry Sequence Analysis Contig Manager Customization
![[enter]](https://cdn0.slideserve.com/635908/slide1-dt.jpg)


![[enter]](https://cdn2.slideserve.com/5327398/slide1-dt.jpg)