Download
1 / 26
370 likes | 1.04k Vues
AN OVERVIEW OF THE MALAYSIAN JUICE AND SOFT DRINK MARKETS. ROSLINA ALI ECONOMIC AND TECHNOLOGY MANAGEMENT RESEARCH CENTER MARDI. PRESENTATION OUTLINES. Introduction Scenario Industry/ Market Trends Consumption Market Shares Projections / P rospects/ T echnology

E N D
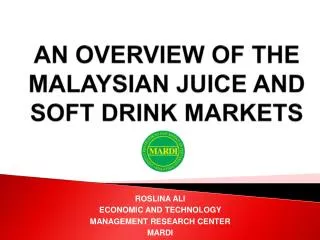
AN OVERVIEW OF THE MALAYSIAN JUICE AND SOFT DRINK MARKETS ROSLINA ALI ECONOMIC AND TECHNOLOGY MANAGEMENT RESEARCH CENTER MARDI
PRESENTATION OUTLINES • Introduction • Scenario • Industry/ Market Trends • Consumption • Market Shares • Projections / Prospects/ Technology • Issues and Challenges • Conclusion
INTRODUCTION • Juices • Naturally contained in fruits and vegetables • prepared by mechanically squeezing or macerating fresh fruits or vegetables • Contain 100% juice • Nectars • Made from fruits or vegetables • Contain 25-99% juice • Added sugar/sweetener
INTRODUCTION • Soft Drink • Does not include milk and milk shake, vegetable juice, fruit juice, tea, coffee, chicory, cocoa and their related products • shall not contain any added alcohol.
CLASSIFICATION OF JUICES • Fruit/ Vegetable Juice • Juice: • 100% juice content • Nectars: • 25 – 99% juice content • Juice Drinks: • Up to 24% juice content • Fruit-Flavored Drinks: • 0% juice content
CLASSIFICATION OF SOFT DRINKS • Soft Drinks • Carbonates • Fruit/vegetable juice • Bottled water • Functional drinks • Concentrates • Ready-to-drink (RTD) tea • Ready-to-drink (RTD) coffee • Asian specialty drinks
SCENARIO: Juice Sector • Fruit/vegetable juice drinks were the most preferred products contributing 58.7% to the sales value in 2007, followed by nectars (35%), and 100% juice (6.3%). • Malaysia Milk SdnBhd (i.e. Marigold brand) is the market leader of both retail volume and retail value shares.
SCENARIO: Soft Drink Sector • As of 2007,carbonated drinks contributed around 29.9% of sales values, followed by asian specialty drinks (23.7%), functional drinks (20.1%), fruit and vegetable juice (12.2%), concentrates (6.6%), RTD tea (5.7%), and RTD coffee (1.7%). • F&N coca-cola (M) SdnBhd (i.e. 100 Plus, F&N, Coca-cola, and Seasons) controlled 33.2% of the market in 2007 – the largest.
TRENDS: Juice Sector • The total value of retail sales for fruit and vegetable juices showed increasing trends from RM263.5 million in 2002 to RM 352 million in 2007. All subsectors were gradually increasing in the same period. • Increasing health awareness, fast-paced lifestyle, and westernization of society helped to boost demand of these products, as purchasing power of consumers has increased.
TRENDS: Soft Drink Sector Table1. Retail Sales of Soft Drinks by Sector, 2002-2007 (RM Million)
TRENDS: Soft Drink Sector • Off-trade sales in values are gradually increasing from RM2,039.8 mill. to RM2,663.8 in 2002 and 2007, respectively. • Marginally stronger total values in 2007 due to deeper geographical and demographical penetration of such products.
CONSUMPTION: NECTARS Figure 3. Leading Flavors for Nectars: Percentage Volume Breakdown, 2002-2007
CONSUMPTION: Juices Drink Figure 4. Leading Flavors for Juice Drink: Percentage Volume Breakdown, 2002-2007 %
CONSUMPTION: Soft Drinks Figure 5. Percentage Value Growth (Retail sales), 2002-2007
MARKET SHARES: Juices Table 2. Top 10 Brand Shares of Fruit/Vegetable Juice by Retail Sales Value, 2007
MARKET SHARES: Soft Drinks Table 3. Top 10 Brand Shares of Soft Drinks by Off-trade Value, 2007
PROJECTION: JUICE SECTOR Figure 6. Projection of Retail Sales for Fruit/Vegetable Juice by Subsector, 2010-2012 (RM Million)
PROJECTION: SOFT DRINK SECTOR Figure 7. Projection of Retail Sales for Soft Drinks by Subsector, 2010-2012 (RM Million)
PROSPECTS: JUICE SECTOR • Fruit/vegetable juices (i.e 100% juice, nectars and juice drinks) are expected to grow steadily from RM346.2 mill. in 2010 to RM363.9 mill. in 2012. • The constant growth value is due to increasing health consciousness, particularly middle and high income consumers. • New healthy products development include sugar-free/reduced, fat-free/reduced, preservative-free, artificial coloring-free are expected to help drive the growth of fruit/vegetable juices over the forecast period.
PROSPECTS: SOFT DRINK SECTOR • Soft drink sector are expected to increase from RM 3,152.3 mill. to RM 3,411.2 mill. in 2010 and 2012, respectively. • Carbonated drink subsector (25.9%) are expected to contribute the largest proportion in the soft drink sector in 2012, followed by asian specialty drink (23%), functional drinks (19.5%),fruit and vegetables juice (10.8%), concentrates (6.7%), Bottled water (6.6%), RTD tea (5.5%), and RTD coffee (1.9%).
TECHNOLOGY ADVANCEMENTS • Technology of hurdle effect for processing fruit/vegetable cordials • Technology of pasteurization for processing high quality fruit/vegetable juices • Technology for processing high acidic fruits/vegetables canning juices/drinks • Technology of processing fruits/vegetables/herbs juices and drinks
ISSUES AND CHALLENGES • Increasing trends of health and wellness • sugar-free • fat-free • vitamins and minerals added • non-carbonated drink • No artificial coloring • Diseases resistant • Supply of raw materials • The most preferred flavors are orange and apple which highly rely on exports.