ANOVA: Analysis of Variance
270 likes | 1.02k Vues
ANOVA: Analysis of Variance. What Is It?. Analysis of Variance (ANOVA): allows for the simultaneous comparison of the difference between two or more means Partition : a statistical procedure in which the total variance is divided into separate components

ANOVA: Analysis of Variance
E N D
Presentation Transcript
ANOVA: Analysis of Variance
What Is It? • Analysis of Variance (ANOVA): allows for the simultaneous comparison of the difference between two or more means • Partition: a statistical procedure in which the total variance is divided into separate components • Partitioning of variance is what gives the ANOVA its name • One-Way ANOVA: compares more than two levels of a single IV
General Linear Model • Factor: the term used for an IV in an ANOVA • Factors have several Levels (values or conditions) • Major Assumptions: • The only difference in means is due to the levels of the IV • The variances of the groups are equivalent (homogeneity of variance)
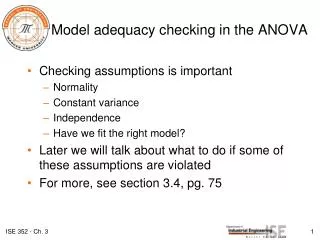
Assumptions of ANOVA • Data meet the criteria for parametric statistics (interval/ratio level data). • The data is normally distributed in each group. • There is homogeneity of variance • The observations in each sample are independent of one another.
Components of Variance • Total Variance: the variance of all scores in the data set regardless of experimental group • Comprised of: • Between-Groups Variance • Within-Groups Variance
Within-Groups Variance • Within-Groups Variance: estimate of the average variance within each group • Homogeneity of Variance: σ12 = σ22 = σ32 = … σj2
Between-Groups Variance • Between-Groups Variance: estimate of variance between group means • Two Sources: • Error Variance: uncontrolled and unpredicted differences among individual scores; the within-groups variance estimates the error variance • Treatment Variance: the variance among group means that is due to the effects of the IV
The F-Ratio • F-Ratio: the ratio of the between-groups variance divided by the within-groups variance • Can be expressed as: • Or • Or
The F-Ratio • No Treatment Effect • Treatment Effect Present
Is it Significant? • Same Concept: distributions represent the probability of various F-ratios when the null hypothesis is true • Two types of degrees of freedom determine the shape of the distribution. • Between-Groups • Within-Groups or • If computed F > critical F (or if the computer tells you it is), the F statistic is significant.
Post What? • The F-ratio does not specify which means are different from other means. • It only implies that the difference between the means (at least two) is great enough to be statistically significant. • Post hoc tests utilize pairwise comparisons to determine which groups are statistically different.
Using SPSS to Compute a One-Way ANOVA • Analyze General Linear Model Univariate • Move the independent variable to the Fixed Factor(s) box Move the dependent variable to the Dependent Variable box • Click Options highlight the independent variable in the Factor(s) box and move it to the Display Means for box Under Display, check descriptive statistics, estimates of effect size, and homogeneity tests Note that the significance level is already set at 0.05 Click Continue • Click Post Hoc highlight the independent variable in the Factor(s) box and move it to the Post Hoc Tests for box Under Equal Variances Assumed, check Tukey (not Tukey’s-b) Click continue.
What Does It All Mean? The descriptive statistics box provides the mean, standard deviation, and number for each group. Levene’s test is designed to compare the error variance of the dependent variable across groups. We do not want this result to be significant.
Understanding the Output The row you are interested in is the row which has the name of your variable in it. The between df appear in this row; the within degrees of freedom appear in the error row. F is your test statistic, and Sig is its probability. Estimated marginal means (the next box), I did not put here. It merely provides the 95% confidence intervals for each of the means.
Post Hoc Analysis Multiple Comparisons provide the mean difference between each level of the IV and its significance. The numbers in this box repeat themselves. It is only necessary to interpret one of each comparison… which one depends on the hypothesis.