Download
1 / 30
300 likes | 453 Vues
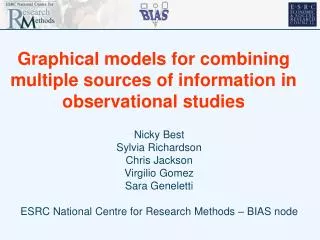
Graphical models for combining multiple sources of information in observational studies. Nicky Best Sylvia Richardson Chris Jackson Virgilio Gomez Sara Geneletti ESRC National Centre for Research Methods – BIAS node. Outline. Overview of graphical modelling

E N D
Graphical models for combining multiple sources of information in observational studies Nicky Best Sylvia Richardson Chris Jackson Virgilio Gomez Sara Geneletti ESRC National Centre for Research Methods – BIAS node
Outline • Overview of graphical modelling • Case study 1: Water disinfection byproducts and adverse birth outcomes • Modelling multiple sources of bias in observational studies • Bayesian computation and software • Case study 2: Socioeconomic factors and heart disease (Chris Jackson) • Combining individual and aggregate level data • Application to Census, Health Survey for England, HES
Graphical modelling Modelling Mathematics Algorithms Inference
1. Mathematics • Key idea: conditional independence • X and W are conditionally independent given Z if, knowing Z, discovering W tells you nothing more about X P(X | W, Z) = P(X | Z) Modelling Mathematics Algorithms Inference
Y Z X W Example: Mendelian inheritance • Y, Z = genotype of parents • W, X = genotypes of 2 children • If we know the genotypes of the parents, then the children’s genotypes are conditionally independent P(X | W, Y, Z) = P(X | Y, Z)
Y Z X W Joint distributions and graphical models Graphical models can be used to: • represent structure of a joint probability distribution….. • …..by encoding conditional independencies P(Y) P(Z) P(X|Y, Z) P(W|Y, Z) P(W,X,Y,Z) = P(W|Y,Z) P(X|Y,Z) P(Y) P(Z) Factorization thm: Jt distribution P(V) = P(v | parents[v])
Where does the graph come from? • Genetics • pedigree (family tree) • Physical, biological, social systems • supposed causal effects (e.g. regression models)
A B Y Z X D W C • Conditional independence provides basis for splitting large system into smaller components
Conditional independence provides basis for splitting large system into smaller components A B Y Y Z Y Z W X D W C
2. Modelling Modelling Mathematics Algorithms Inference
Building complex models Key idea • understand complex system • through global model • built from small pieces • comprehensible • each with only a few variables • modular
Example: Case study 1 • Epidemiological study of low birth weight and mothers’ exposure to water disinfection byproducts • Background • Chlorine added to tap water supply for disinfection • Reacts with natural organic matter in water to form unwanted byproducts (including trihalomethanes, THMs) • Some evidence of adverse health effects (cancer, birth defects) associated with exposure to high levels of THM • SAHSU are carrying out study in Great Britain using routine data, to investigate risk of low birth weight associated with exposure to different THM levels
Data sources • National postcoded births register • Routinely monitored THM concentrations in tap water samples for each water supply zone within 14 different water company regions • Census data – area level socioeconomic factors • Millenium cohort study (MCS) – individual level outcomes and confounder data on sample of mothers • Literature relating to factors affecting personal exposure (uptake factors, water consumption, etc.)
Model for combining data sources f THMzt [true] s2 THMztj [raw] THMik [mother] THMim [mother] b[T] yim yik b[c] cik cim qi
Regression sub-model (MCS) Regression model forMCS data relating risk of low birth weight (yim) to mother’s THM exposure and other confounders (cim) f THMzt [true] s2 THMztj [raw] THMik [mother] THMim [mother] b[T] yim yik b[c] cik cim qi
Regression sub-model (MCS) Regression model forMCS data relating risk of low birth weight (yim) to mother’s THM exposure and other confounders (cim) Logistic regression yim ~ Bernoulli(pim) logit pim = b[c] cim + b[T] THMim i indexes small area m indexes mother [mother] THMim [mother] b[T] yim b[c] cim cik = potential confounders, e.g. deprivation, smoking, ethnicity
Regression sub-model (national data) Regression model fornational data relating risk of low birth weight (yik) to mother’s THM exposure and other confounders (cik) f THMzt [true] s2 THMztj [raw] THMik [mother] THMim [mother] b[T] yim yik b[c] cik cim qi
Logistic regression • yik ~ Bernoulli(pik) • logit pik = b[c] cik + b[T] THMik • i indexes small area • k indexes mother [mother] Regression sub-model (national data) Regression model fornational data relating risk of low birth weight (yik) to mother’s THM exposure and other confounders (cik) THMik [mother] b[T] yik b[c] cik
Missing confounders sub-model Missing data model to estimate confounders (cik) for mothers in national data, using information on within area distribution of confounders in MCS f THMzt [true] s2 THMztj [raw] THMik [mother] THMim [mother] b[T] yim yik b[c] cik cim qi
Missing confounders sub-model Missing data model to estimate confounders (cik) for mothers in national data, using information on within area distribution of confounders in MCS cim ~ Bernoulli(qi) (MCS mothers) cik ~ Bernoulli(qi) (Predictions for mothers in national data) cik cim qi
THM measurement error sub-model Model to estimate true tap water THM concentration from raw data f THMzt [true] s2 THMztj [raw] THMik [mother] THMim [mother] b[T] yim yik b[c] cik cim qi
THMztj ~ Normal(THMzt,s2) z = water zone; t = season; j = sample (Actual model used was a more complex mixture of Normal distributions) [raw] [true] THM measurement error sub-model Model to estimate true tap water THM concentration from raw data THMzt [true] s2 THMztj [raw]
THM personal exposure sub-model Model to predict personal exposure using estimated tap water THM level and literature on distribution of factors affecting individual uptake of THM f THMzt [true] s2 THMztj [raw] THMik [mother] THMim [mother] b[T] yim yik b[c] cik cim qi
THM = ∑kTHMztx quantity (f1k) x uptake factor (f2k) where k indexes different water use activities, e.g. drinking, showering, bathing [mother] [true] THM personal exposure sub-model Model to predict personal exposure using estimated tap water THM level and literature on distribution of factors affecting individual uptake of THM f THMzt [true] THMik [mother] THMim [mother]
3. Inference Modelling Mathematics Algorithms Inference
Bayesian Full Probability Modelling • Graphical approach to building complex models lends itself naturally to Bayesian inferential process • Graph defines joint probability distribution on all the ‘nodes’ in the model Recall: Joint distribution P(V) = P(v | parents[v]) • Condition on parts of graph that are observed (data) • Calculate posterior probabilities of remaining nodes using Bayes theorem • Automatically propagates all sources of uncertainty
Data f Unknowns THMzt [true] s2 THMztj [raw] THMik [mother] THMim [mother] b[T] yim yik b[c] cik cim qi
MCMC algorithms are able to exploit graphical structure for efficient inference Bayesian graphical models implemented in WinBUGS 4. Algorithms Modelling Mathematics Algorithms Inference