Download
1 / 18
180 likes | 342 Vues
Overview of the global AIDS epidemic. Peter Ghys, UNAIDS. Data sources HIV prevalence HIV incidence AIDS Mortality. Overview. Data sources. HIV prevalence (%) among pregnant women attending antenatal clinics in Sub-Saharan Africa, 1997–2007. Southern Africa. Botswana. 50. Burkina Faso.

E N D
Overview of the global AIDS epidemic Peter Ghys, UNAIDS
Data sources HIV prevalence HIV incidence AIDS Mortality Overview
HIV prevalence (%) among pregnant women attending antenatal clinics in Sub-Saharan Africa, 1997–2007 Southern Africa Botswana 50 Burkina Faso Lesotho 40 Mozambique 30 Namibia NOTE: Analysis restricted to consistent surveillance sites for all countries except South Africa (by province) and Swaziland (by region) Median HIV prevalence (%) 20 South Africa Ghana Swaziland 10 Zimbabwe 0 1997– 1998 1997– 1998 1997– 1998 1999– 2000 1999– 2000 1999– 2000 2001 2001 2001 2002 2002 2002 2003 2003 2003 2004 2004 2004 2005 2005 2005 2006 2006 2006 2007 2007 2007 Eastern Africa West Africa 20 20 15 15 Ethiopia 10 10 Median HIV prevalence (%) Median HIV prevalence (%) Côte d'Ivoire 5 5 Kenya Senegal 0 0
National population-based surveys, 2001-2007 • Sub-Saharan Africa: 35, including • five 2nd surveys • one 3rd survey • Asia: 3 • Caribbean: 3 (including one 2nd survey) • South America: 1
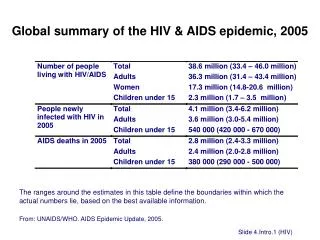
Estimated adult (15–49 years) HIV prevalence (%) globally and in Sub-Saharan Africa, 1990–2007 8 Sub-Saharan Africa 7 6 5 Adult prevalence (%) 4 3 GLOBAL 2 1 0 1990 1991 1992 1993 1994 1995 1996 1997 1998 1999 2000 2001 2002 2003 2004 2005 2006 2007 Year
Estimated number of adults and children living with HIV, by region, 1990–2007 40 Oceania Millions Middle East & North Africa 30 Eastern Europe & Central Asia Latin America and Caribbean North America and W & C Europe Asia 20 Sub-Saharan Africa 10 0 1990 1991 1992 1993 1994 1995 1996 1997 1998 1999 2000 2001 2002 2003 2004 2005 2006 2007 Year
Estimated number of adults and children living with HIV, by region (excluding Sub–Saharan Africa), 1990–2007 Oceania 12 Millions Middle East & North Africa 9 Eastern Europe & Central Asia Latin America and Caribbean North America and W & C Europe Asia 6 3 0 1990 1991 1992 1993 1994 1995 1996 1997 1998 1999 2000 2001 2002 2003 2004 2005 2006 2007 Year
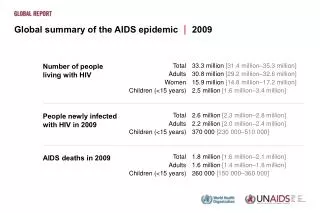
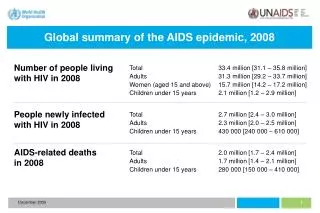
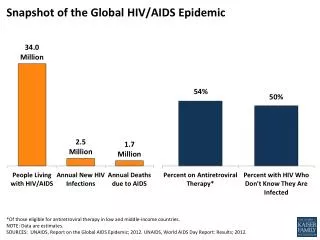
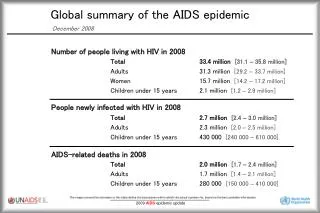
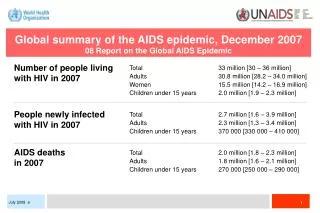
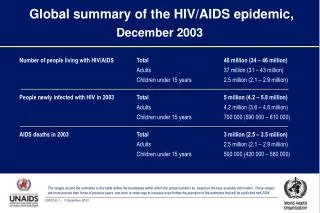
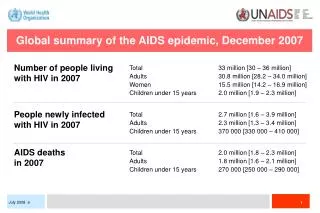
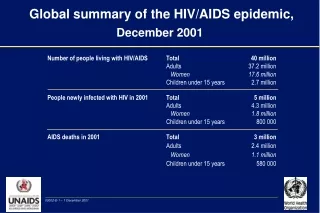
A global view of HIV infection 33 million people [30–36 million] living with HIV, 2007
Estimated number people newly infected with HIV globally, 1990–2007 6 Millions 5 4 3 2 1 0 1990 1991 1992 1993 1994 1995 1996 1997 1998 1999 2000 2001 2002 2003 2004 2005 2006 2007 Year This bar indicates the range
New infections among children, 1990–2007 600 000 500 000 400 000 300 000 200 000 100 000 0 1990 1991 1992 1993 1994 1995 1996 1997 1998 1999 2000 2001 2002 2003 2004 2005 2006 2007 Year This bar indicates the range
Number and percentage of HIV-positive pregnant women receiving antiretroviral prophylaxis, 2004–2007 40 600 000 35 500 000 30 400 000 Number of HIV-positive pregnant women receiving antiretrovirals % of HIV-positive pregnant women receiving antiretrovirals 25 300 000 20 15 200 000 10 100 000 5 0 0 2004 2005 2006 2007 Year Source: UNAIDS, UNICEF & WHO, 2008; data provided by countries.
Estimated number of adult and child deaths due to AIDS globally, 1990–2007 3.0 Millions 2.5 2.0 1.5 1.0 0.5 0 1990 1991 1992 1993 1994 1995 1996 1997 1998 1999 2000 2001 2002 2003 2004 2005 2006 2007 Year This bar indicates the range
Number of people receiving antiretroviral drugs in low- and middle income countries, 2002−2007 3.0 2.8 North Africa and the Middle East Millions 2.6 2.4 2.2 Eastern Europe and Central Asia 2.0 1.8 1.6 East, South and South-East Asia 1.4 1.2 Latin America and the Caribbean 1.0 0.8 0.6 Sub-Saharan Africa 0.4 0.2 0.0 end- 2002 end- 2003 end- 2004 end- 2005 end- 2006 end- 2007 Year Source: Data provided by UNAIDS & WHO, 2008.