Download
1 / 17
170 likes | 370 Vues
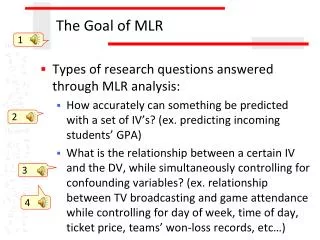
The Goal of MLR. 1. Types of research questions answered through MLR analysis: How accurately can something be predicted with a set of IV’s? (ex. predicting incoming students’ GPA)

E N D
The Goal of MLR 1 • Types of research questions answered through MLR analysis: • How accurately can something be predicted with a set of IV’s? (ex. predicting incoming students’ GPA) • What is the relationship between a certain IV and the DV, while simultaneously controlling for confounding variables? (ex. relationship between TV broadcasting and game attendance while controlling for day of week, time of day, ticket price, teams’ won-loss records, etc…) 2 3 4
Entering IV’s into the MLR Model • Standard regression • Full model approach=all IV’s used in model at same time • Some researchers will simply end the analysis at this point, others will examine assumptions, outliers, multicollinearity and create reduced models until they identify a single “best” model to predict the DV • This is the process we will use in this class, although testing assumptions is beyond our scope here 1 2
Entering IV’s into the MLR Model • Sequential or Hierarchical regression • The researcher determines an order to entering variables into the regression equation, usually based on some sort of theoretical or logical rationale • The researcher then makes judgments as to the unique contributions of each IV in determining which to include & which to delete from the model • Not radically different than the previous process of reducing the full model, just a slightly different process – sequential is sometimes thought to be prone to researcher bias in its subjectivity 1
Entering IV’s into the MLR Model • Statistical (often called Stepwise) regression • IV’s are entered into the regression equation one at a time and is assessed in terms of what it adds to the equation at that point of entry and for how it impacts multicollinearity & assumptions • Forward regression=IV with highest correlation to DV added first, then the second-highest, etc… • Backward regression=All variables entered, then one with lowest correlation to DV taken away, then the second-lowest, etc… • Stepwise regression =A combination of alternating forward and backward regression procedures • The use of stepwise regression is highly controversial in statistics 1
Work with small # of predictors 1 • Why? • Parsimony (a principle of good science) • Small # predictors improves n/k ratio • Greater # predictors, higher chance of shared variance among them • Large number of predictors can be replaced with smaller number of “constructs” -“principal components” – see your next stats class…(factor analysis)
MLR Example • Let’s go through this process in an example… • RQ: What is the relationship between television broadcasting, both national and local, and game attendance in men’s college basketball (while controlling for potentially confounding variables)? • Let’s establish α = .05 a priori 1
MLR Example • Graph the data to look for outliers 1 Can also use an “influential point” estimator in SPSS (such as cook’s distance (see later)
MLR Example • Examine the correlation matrix to see which variables are correlating with the DV and for multicollinearity among IV’s • Note: the entire correlation matrix would not fit here as it is 21x21 variables • Very little multicollinearity…no pairwise correlations above r=.45 and few even above r=.3 1
MLR Example • Find the R2 and Std. Error #’s from the “Model Summary” • What can we learn here? 1
MLR Example • The “ANOVA” box performs an F-test to accept/reject the null hypothesis that none of the IV’s is purposeful in predicting the DV 1 2 3 4
MLR Example • The coefficients box provides data on each of the IV’s while all are in the model at the same time…essentially provides an examination of each IV’s unique contribution to predicting the DV while controlling for all of the other IV’s 1. • 3. The unstandardized beta coefficients represent the y-intercept and slopes of the regression equation…these can be used as we did with SLR to predict the DV knowing the value of the IV’s • 4. The standardized beta coefficient allows us to compare the strength of each IV in predicting the DV • 2. The p-value (Sig.) tells us whether each IV is a significant predictor of the DV (compare each to alpha level)
MLR Example 2 1
MLR Example 1 • The coefficients box (continued) • Which variables correlate significantly with game attendance while controlling for other variables? • Which variables are the strongest predictors of game attendance? • How much does attendance increase or decrease if a game is broadcast on national television? on local television? 2 3 4
MLR Example • Am I satisfied with this model, or should I examine another model by reducing via IV elimination? • No data reduction was used with this study because of the research question being addressed (use of most of the IV’s merely for control purposes) • Ignoring that, what reduced models might we want to examine if we were so inclined? 1
Other Prediction Statistics • Canonical correlation can be used to predict the value of two or more DV’s with two or more IV’s • Ex. Using HS GPA & SAT to predict undergrad GPA and graduation rate 1
Other Prediction Statistics • Discriminant analysis can be used to predict classification into categories of the DV with two or more IV’s • Ex. Using IV’s like age, education, hours worked per week, and income to predict one’s life perspective (dull, routine, or exciting) • Logistic regression can be used to predict classification into a dichotomous DV with two or more IV’s • Ex. Using variables to predict steroid user or non-user 1 2