Download
1 / 46
470 likes | 633 Vues
Transportation & Supply Chain Systems. John H. Vande Vate Spring, 2001. John H. Vande Vate Professor and EMIL Director Office: 433 Phone: (404) 894-3035 Office Hours: Tuesday, Thursday 11-12 or By appointment. Who am I?. Administrative Details. Class Home Page:

E N D
Transportation & Supply Chain Systems John H. Vande Vate Spring, 2001 1
John H. Vande Vate Professor and EMIL Director Office: 433 Phone: (404) 894-3035 Office Hours: Tuesday, Thursday 11-12 or By appointment Who am I? 2
Administrative Details • Class Home Page: www.isye.gatech.edu/~jvandeva/Classes/6203/syllabus2001.htm Keep up with information here! • Text: Logistic Systems Analysis by Daganzo • You may also want to read: • Business Logistics Management by Ballou 3
Exams: 60% Mid-term: March 1, 2001 Final Projects: 30% Groups of 3 or 4 Class Participation: 10% What you contribute to the class Grading 4
Issues and Tools for Design and Analysis of Logistics Systems Daganzo: Analytical models based on summary data Class Discussions: Mathematical Programming models incorporating more detailed data Objectives 5
Analytic models: Identify trade-offs Communicate arguments Ball park answers Numerical Models: Consider the details Manage the complexity Refine solutions Motivation 6
AMPL www.ampl.com AMPL A Modeling Language for Mathematical Programming, Fourer, Gay and Kernighan $ No full version generally available XPress-MP: Academic version available for download at: www.isye.gatech.edu/class/xpress/ Full version available in the graduate and undergraduate labs. Algebraic Modeling Languages 7
AIMMS: This application is supported in the Lab. Student version?? MPL or related tools: Can be downloaded free from www.maximal-usa.com/download/ No full version available More Options 8
Good: Executive Master’s in International Logistics CIO’s, VP’s, Directors and Managers from Agilent, Baxter, Fedex, Ford, GM, Hapag-Lloyd, Intel, Lucent, Milliken, Motorola, Ryder, UPS, … Meeting with Execs from BMW, DaimlerChrysler, HP, Infineon, Quelle, … ... Good and Bad of EMIL 9
Bad: I will be out of the country January 19 to February 3 Possible trip to Asia in April Still wanted to do this class. Good and Bad of EMIL 10
Weeks of January 22 January 29 No class. Your assignment is: Get access to and master a modeling language Complete a small “case” to test your skill. Resolution 11
Build and solve a mathematical programming model for determining the best strategy for shipping the goods in The example of Section 1.2 of Daganzo Comments: Use the data given in the text and the distances given on the class home page Your model must be linear (integer). The plants and warehouse stagger shipments. Project 1: Due February 6 12
Shipments between plants and and from plants to the warehouse are full truck load. Each DC receives all supply of each part from one plant. (Different parts may come from different plants) If your model is too large for the student version of the solver, drop the last dcs until it fits. Comments Cont’d 13
Model with clear but concise explanation Solution Summarize intelligently Compare with an Analytic model What are the key differences and why are they there. To Turn In 14
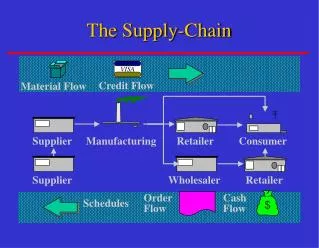
Develop a distribution strategy to minimize inventory and transportation costs Purpose: Illustrate the analytical modeling approach Outline issues covered in the course Illustrative Example 16
Products: Computers: CPU, Monitor, Keyboard Televisions: TV and Console Distribution Centers 100 across the US Sell 10 TVs and 10 computers per day Overview 17
An Illustrative Example Facts 18
All direct shipments in full truckloads All shipments via Indianapolis in full truckloads All direct shipments at the optimal frequency All shipments via Indianapolis at the optimal frequency …. Strategies to Consider 19
Shipments on the order of 1,000 miles Simplification Facts 20
At the DC’s? 1/2 truckload or 500 Consoles at $100 each: $ 50,000 1/2 truckload or 3,000 CPUs at $300 each: $900,000 1/2 truckload or 1,500 Monitors at $400 each: $600,000 $1,550,000 Carrying cost: 15% of $1,550,000 or $232,500 Total Carrying cost at the DCs: $23,250,000! Inventory 21
Two Extremes Simultaneous shipments Staggered shipments Reality? Inventory at the Plants 22
Green Bay ships once every 2.4 years Inventory is 1.2 years demand or 3,000 CPUs Inventory value is $900,000 Inventory carrying cost is $135,000 Denver ships 2.5 times per year Inventory is 20% of annual demand or 500 Consoles Inventory value is $50,000 Inventory carrying cost is $7,500 Indianapolis ships 1.6 times per year Inventory is 5,000/3.2 or about 1,500 items Inventory value is $600,000 Inventory carrying cost is $90,000 Simultaneous shipments 23
Each plant holds 1/2 a truck load Total plant inventory like one more DC Staggered Shipments 24
Transportation Costs: $ 460,000 Inventory Costs at DCs: $ 23,250,000 Inventory Costs at Plants: $ 232,500 Total: $ 23,942,500! The Next Step: Trade-off Inventory and Transportation Total Cost 25
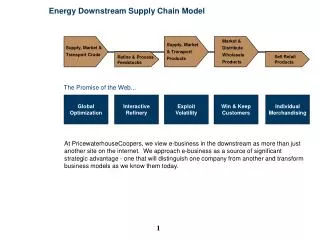
Using Transshipment to Reduce Inventory Strategy 2: Assemble Products in Indianapolis and distribute by truckload from there Back to Our Example 30
Via Indianapolis Facts 31
Inventory at a DC: Visited by truck 4.6 times per year Same as before So inventory costs at DC are the same as before, right? Inventory Effects 32
Total Inventory Carrying Cost at DCs: $4,891,300 compared with $23,250,000 under earlier strategy. Explain! Wrong! 33
The Difference Other resolutions? 34
Denver 1/2 truckload of Consoles Same as before, right? $7,500 Green Bay 1/2 truckload of CPUs Same as before: $135,000 Indianapolis 1/2 truckload of Consoles :$ 7,500 1/2 truckload of CPUs :$135,000 1/2 truckload of TVs and Computers:$ 48,900 $191,400 Inventory at the Plants 35
Transportation Costs: $ 751,800 Inventory Costs at DCs: $ 4,891,300 Inventory Costs at Plants: $ 333,900 Total: $ 5,977,000 Without Transshipment Transportation Costs: $ 460,000 Inventory Costs at DCs: $ 23,250,000 Inventory Costs at Plants: $ 232,500 Total: $ 23,942,500! With Transshipment 36
Disadvantages Capital Cost of Warehouse Extra handling at Warehouse Advantages Economies of Scale in Assembly Reduced demands on DC labor Other Advantages/Disadvantages 37
Workload balancing: UPS case Combinatorial Bidding: Home Depot Case Yield/Demand Management …. Other Issues 45