Download

1 / 150
1.51k likes | 1.83k Vues
International Financial Markets 2. Major Markets and Their Assets. - 1 -. Prof. Dr. Rainer Maurer. 2. Major Markets and Their Assets 2.1. Capital Markets 2.1.1. Credit Markets 2.1.2. Stock Markets 2.2. Foreign Exchange Markets 2.2.1. Spot Markets 2.2.2. Forward Markets

E N D
International Financial Markets2. Major Markets and Their Assets - 1 - Prof. Dr. Rainer Maurer
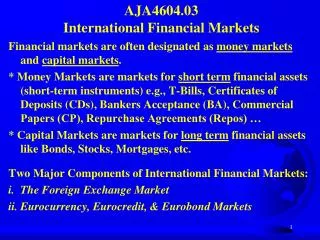
2. Major Markets and Their Assets 2.1. Capital Markets 2.1.1. Credit Markets 2.1.2. Stock Markets 2.2. Foreign Exchange Markets 2.2.1. Spot Markets 2.2.2. Forward Markets 2.3. Derivatives 2.3.1. Forwards and Futures 2.3.2. Options Literature:1) ◆Chapter 4, 5, 6, 7, 8 Fell, Lindsay (2000): Financial Products and Markets, Continuum, London. ◆Chapter 17, 18, 19, 21 Kohn, Meir (1994): Financial Institutions and Markets, McGraw-Hill, New York. 2. Major Markets and Their Assets - 2 - 1) The recommended literature typically includes more content than necessary for an understanding of this chapter. Relevant for the examination is the content of this chapter as presented in the lectures. Prof. Dr. Rainer Maurer
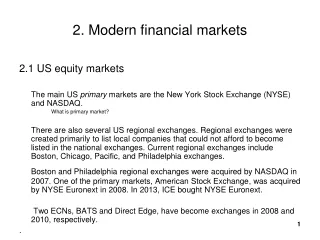
2. Major Markets and Their Assets Financial Markets Capital Markets Foreign Exchange Markets Credit Markets Spot Market Forward Market Stock Market Corporate Debt Mortgage Debt Money Market Governm. Securities Derivatives Forwards Futures Options Swaps - 3 - Prof. Dr. Rainer Maurer
2. Major Markets and Their Assets 2.1. Capital Markets 2.1.1. Credit Markets 2.1.2. Stock Markets 2.2. Foreign Exchange Markets 2.2.1. Spot Markets 2.2.2. Forward Markets 2.3. Derivatives 2.3.1. Forwards and Futures 2.3.2. Options 2. Major Markets and Their Assets2.1.1. Credit Markets - 4 - Prof. Dr. Rainer Maurer
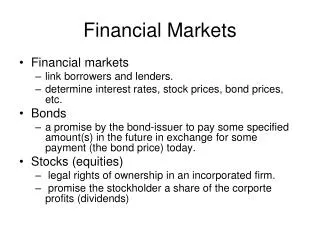
2. Major Markets and Their Assets2.1.1. Credit Markets • Securities withfixed interest rates(bonds in the following): • …are contracts that guarantee their owner a payment of a fixed annual rateof money plus the payment of the face valueat the end of maturity. • …are typically issued by governments and (to a smaller part) by large firms. • Before the day of issue the issuer publishes for example the following kind of information: • Fixed annual interest rate: 5 % of face value • Face Value (=redemption price): 100 € • Periods to maturity: 4 years - 6 - Prof. Dr. Rainer Maurer
2. Major Markets and Their Assets2.1.1. Credit Markets • If the market interest rate is lower than the fixed interest rate, the market price of the bond is higher than its face value (=Agio). • For example: Market interest rate at day of issue = 4% • The higher market price (= Agio) causes the internal rate of return of this bond to fall below its fixed rate and to equal the market interest rate! - 7 - Prof. Dr. Rainer Maurer
2. Major Markets and Their Assets2.1.1. Credit Markets • At the day of issue the market price of the bond is then determined by the prevailing market interest for a bond with the same risk rate following the discounted cash-flow method. • For example: Market interest rate at day of issue = 6 % • Consequently, if the market interest rate is higher than the fixed interest rate of the bond, the market price of the bond is lower than its face value (=Disagio). • The lower market price causes the internal rate of return of this bond to rise above its fixed rate and to equal the market interest rate! - 8 - Prof. Dr. Rainer Maurer
2. Major Markets and Their Assets2.1.1. Credit Markets • Only if the market interest rate equals the fixed interest rate, the market price of the bond equals its face value (= Pari) • For example: Market interest rate at day of issue = 5% • At this market price, the internal rate of return of this bond exactly equals the market interest rate (=Pari)! - 9 - Prof. Dr. Rainer Maurer
2. Major Markets and Their Assets2.1.1. Credit Markets • Why does the price of a bond always adjust so that its internal rate of returnequals the market interest rate? • This adjustment is made by market forces, i.e. movements of supply and demand: • If the internal rate of return of a bond were higherthan the market interest rate, people would buy this bond only. As a consequence, this increase in demand causes the market price of the bond to grow until it reaches a level where its internal rate of returnequals the market interest rate. • If the internal rate of return of a bond were lowerthan the market interest rate, people would not like to buy this bond. As a consequence, this lack of demand causes the market price of the bond to fall until it reaches a level where its internal rate of returnequals the market interest rate. - 10 - Prof. Dr. Rainer Maurer
2. Major Markets and Their Assets2.1.1. Credit Markets • The risk profile of bonds with fixed rates: • If you buy a fixed rate bond and keep it to the end of maturity, you will receive an ex ante fixed return plus the face value. Consequently, the internal rate of return is fix. • If you keep your fixed rate bond to the end of maturity, the only risk involved in a bond is the default risk of the issuer. • Therefore fixed rate securities of different issuers, are bonds of different default risk: • Government Bonds • Corporate Bonds • Therefore, fixed rate bonds of different issuers typically bear different yields to maturity – i.e. a risk premium. - 11 - Prof. Dr. Rainer Maurer
Source: Deutsche Bundesbank = Government Bonds = Corporate Bonds - 12 - Prof. Dr. Rainer Maurer
2. Major Markets and Their Assets2.1.1. Credit Markets • The risk profile of bonds with fixed rates: • However, if you sell your fixed rate bond before the end of maturity, you may receive a market price for your fixed rate bond significantly lower than its face value. • Consequently, selling a fixed rate bond before maturity involves “price risk”. • Why is it possible that the market price of a fixed rate bond decreases? • Demand and supply on the market for fixed rate securities may have changed since you have bought your fixed rate bond. • For example: Supply of fixed rate bonds (with the same maturity as yours) may have grown faster than demand, so that prices may have declined. - 13 - Prof. Dr. Rainer Maurer
2. Major Markets and Their AssetsSummary: Price Risk of Fixed Rate Securities Market for fixed rate securites with a maturity of 4 years i Date of issue: t Market interest rate for fixed rate bonds with a maturity of 4 years: io = 5% => As already seen above, if the fixed rate of a bond equals exactly 5%, its market price will equal its face value (100 €): D(i) =Credit Supply io S(i) =Credit Demand (€) Bo - 14 - Prof. Dr. Rainer Maurer
2. Major Markets and Their AssetsSummary: Price Risk of Fixed Rate Securities One year later: t+1 Market supply (=credit demand) has grown so that interest rate for fixed rate securities with a maturity of 3 years equals: io = 6% => As already seen above, the price of the bond has to decrease to adjust its internal rate of return to the market interest rate. Market for fixed rate securites with a maturity of 3 years i D(i) i1 io S(i)2 S(i)1 (€) B1 Bo - 15 - Prof. Dr. Rainer Maurer
2. Major Markets and Their Assets2.1.1. Credit Markets • The risk profile of securities with fixed rates: • Of course, this decrease in market price is only a disadvantage, if you need to sell your bond before its maturity. • Only in this case you will suffer from “price risk”. • If you hold your bond until the end of maturity, you will get back all your money plus a fixed rate of return. • Consequently, if you cannot be sure, whether you need your money back before the end of maturity or not, don’t buy a bond with a fixed rate of return. Else you will suffer from price risk. • If you cannot be sure, whether you need your money back before the end of maturity or not, you better buy a security with a floating rate or a similar instrument (e.g. giro account). - 16 - Prof. Dr. Rainer Maurer
To sum up: The market price of a fixed rate bond does always adjust so that its internal rate of return equals the market interest rate. If the market interest rate increases, the price of the bond decreases. If the market interest rate decreases, the price of the bond increases. As a consequence of this behavior the market price of a fixed rate bond can display a high variance and hence a high price risk. However, the holder of a bond suffers from this price risk only, if he sells the bond before its maturity. If he keeps the bond until its maturity he gets the promised face value as well as all the promised interest payments back. 2. Major Markets and Their Assets2.1.1. Credit Markets - 18 - Prof. Dr. Rainer Maurer
2. Major Markets and Their Assets 2.1. Capital Markets 2.1.1. Credit Markets 2.1.2. Stock Markets 2.2. Foreign Exchange Markets 2.2.1. Spot Markets 2.2.2. Forward Markets 2.3. Derivatives 2.3.1. Forwards and Futures 2.3.2. Options 2. Major Markets and Their Assets2.1.2. Stock Markets - 19 - Prof. Dr. Rainer Maurer
2. Major Markets and Their Assets2.1.2. Stock Markets • Stocks1) • …are a right to part ownership of a joint stock company • …entitle their owner to the “residual profit” of the company, i.e. any extra wealth that the company might generate, after all other claimants (suppliers, employees, providers of debt capital, the taxman) have received their money. • …do not obligate their owner to cover the debts of the company beyond the amount actually subscribed for the stock (“limited liability”).2) • What does “residual profit” mean? Take a look at the next graph: 1) Synonyms for stocks: shares (Brit.), equities (general term for stocks + other own capital) 2) In most countries stocks can only be issued by “joint stock companies” (or “corporations”), i.e. companies which are set up in accordance with a particular body of law in the country. - 22 - Prof. Dr. Rainer Maurer
Money received from sales ./. Payments for costs to suppliers of goods and services and to labor ./.Payment of interest on outside capital (to holders of securities and to banks) ./.Payment of tax on profit Dividend payments Retained Earnings = Profit after tax = Money available for stockholders = “Residual Profit” - 23 - Prof. Dr. Rainer Maurer
2. Major Markets and Their Assets2.1.2. Stock Markets • The determination of the residual profit shows: • The payment to the owner of a stock is very uncertain. • Many factors affect dividend payments: • Sales success (strength of demand: business cycles as well as quality of products and success of marketing activities) • Development of production costs (energy prices, raw materials, labor etc.) • Development of the costs for outside capital • Development of tax laws • Decision about retained earnings by the directors of the company • Therefore the yield on stocks is uncertain. It depends on the expected values of all these factors. - 24 - Prof. Dr. Rainer Maurer
2. Major Markets and Their Assets2.1.2. Stock Markets • Stocks are daily auctioned on stock markets. • Stock brokers and/or computer chose the market equilibrium price of a stock several times a day so that demand and supply are equilibrated. - 25 - Prof. Dr. Rainer Maurer
List of quotations of a stock market broker for a specific stock 2. Major Markets and Their Assets2.1.2. Stock Markets
Supply Curve € Number of stocks
Supply Curve € Number of stocks
List of quotations of a stock market broker for a specific stock 2. Major Markets and Their Assets2.1.2. Stock Markets
Demand Curve € Number of stocks Menge (kg)
Demand Curve € Number of stocks Menge (kg)
Market Diagram € Supply Supply=350 Demand=350 Demand Number of stocks
List of quotations of a stock market broker for a specific stock 2. Major Markets and Their Assets2.1.2. Stock Markets
Market Diagram € Supply Percentage allotement of demand to supply: 350/450 = 77,7% Supply=450 Excess Supply Demand=350 Demand Number of stocks
Market Diagram Supply € Demand Number of stocks
2. Major Markets and Their Assets2.1.2. Stock Markets • Consequently, the market price of a stock is known every day. • Contrary to fixed rate bonds, the return of a stock, its dividend payment, is not known in advance. • Hence the evaluation of the profitability of a stock must be based on a forecast of future dividend payments. • Such a forecast must use firm specific information on all the factors displayed by the above graph. It is clear that such a forecast is highly insecure. - 36 - Prof. Dr. Rainer Maurer
2. Major Markets and Their Assets2.1.2. Stock Markets • Another problem with dividend forecasts is the infinite maturity of stocks: • While fixed rate bonds typically have finite maturities between 1 and 30 years, • stocks have no redemption date. • One procedure to tackle this problem is the fair value approach: • Forecast based on firm specific data dividend payments over a certain span of time. • Use the average or last dividendpayment (e.g. DT = 5) as a forecast for a perpetuity. • Choose an appropriate discount rate (e.g. i=0,06) and apply the formula for the present value of a perpetuity (P=D/i) to determine the price of the stock after the last year (PT=5/0,06 = 83,3). - 37 - Prof. Dr. Rainer Maurer
2. Major Markets and Their Assets2.1.2. Stock Markets • The resulting flow of payments can then be evaluated either with the internalrate of return method or with the discounted cash flow method. • The more usual method for the evaluation of stock is the discounted cash flow method, for example: • The resulting “fair value” is than used for comparison with the market price of the stock: • Market Price > Fair Value => Stock is “overvalued” => Sell! • Market Price < Fair Value => Stock is “undervalued”=> Buy! - 38 - Prof. Dr. Rainer Maurer
2. Major Markets and Their Assets2.1.2. Stock Markets • Problems of the fair value approach: • The calculation forecast of each single dividend is not only very insecure but also very cumbersome, given all the factors that influence a dividend payment. • The forecast of theresale price has a large weight on the fair value (see the above example): Small changes of the dividend value taken to estimate the resale price have a large impact on the fair value. • The discount rate has also a large impact on the fair value. • The discount rate is unknown and must also be estimated – under consideration of the specific risk of the stock! - 39 - Prof. Dr. Rainer Maurer
2. Major Markets and Their Assets2.1.2. Stock Markets One often used orientation for the appropriate risk specific discount factor of a stock is the Capital Asset Pricing Model (CAPM): ij = yield of a risk-free security + specific risk premium for stock j market return for one unit of risk units of risk attached to stock j ij = + yield of a risk-free security * ij = + * ij = discount rate of stock j, rj = rate of return of stock j, rM = rate of return of the market portfolio, ro= yield of a risk-free security - 40 - Prof. Dr. Rainer Maurer
2. Major Markets and Their Assets2.1.2. Stock Markets • Problems of the discount factor calculation based on the CAPM: • To use the formula, it is necessary to know the future covariance between the yield of the market portfolio and the yield of stock j, cov(ij,rM) and the future variance of yield of the market portfolio var(rM). • Both numbers, however, can only be calculated on the basis of the historic values of these yields. • The present and the future covariance and variance may however be different from the covariance calculated on the basis of past values, since all the factors that influence ij and rM may change. • Consequently, the CAPM is a good theoretical orientation for the determination of an appropriate discount factor. • However, one has to bear in mind that it is also based on a forecast only. - 42 - Prof. Dr. Rainer Maurer
2. Major Markets and Their Assets2.1.2. Stock Markets Key figures for stocks: The “Dividend Yield”: Market price per stock = market value of the stock at period t = Pt Example: Profit after tax = 30 million € Retained earnings = 10 million € Number of stocks = 10 million € Market price of stock = 60 € • => Dividend Yield = ((30 - 10) /10) / 60 = 3,33% - 44 - Prof. Dr. Rainer Maurer
2. Major Markets and Their Assets2.1.2. Stock Markets Key figures for stocks: The “Dividend Yield”: Interpretation: The dividend yield is the yield per period an investor will have, if dividend payments in all future periods stay the same. This number is of particular interest for investors that need a regular income but don’t want to sell their stock in order to realize price gains (e.g. pension funds, investors borrowing to invest). - 45 - Prof. Dr. Rainer Maurer
The dividend yield, Dt/Pt, has reached a historic low since the 80s. This indicates that, since the beginning of the 80s, investors are less interested in dividend payments from stock but price gains. - 46 - Prof. Dr. Rainer Maurer
2. Major Markets and Their Assets2.1.2. Stock Markets Key figures for stocks: The “Price Yield”: Market price per stock = market value of the stock at period t = Pt Example: Market Pricet = 120 € Market Pricet-1 = 100 € • => Price Yield = (120 - 100) /100 = 20 % - 47 - Prof. Dr. Rainer Maurer
2. Major Markets and Their Assets2.1.2. Stock Markets Key figures for stocks: The “Price Yield”: Interpretation: The price yield is the yield per period an investor will have, if he buys the share at the beginning of a period and sells it at the end, neglecting the dividend payment. This number is of particular interest for speculation-oriented investors. - 48 - Prof. Dr. Rainer Maurer
This diagram reveals that since the beginning of the 1980s the total return from stock investments is driven by price increases: The motive for stock investment is no longer the dividend payment but the potential price gain. - 49 - Prof. Dr. Rainer Maurer
- 50 - Prof. Dr. Rainer Maurer
2. Major Markets and Their Assets2.1.2. Stock Markets Key figures for stocks: The “Total Yield”: Dividend Yieldt = 3,3% Price Yieldt = 20 % • => Total Yield = 23,3% - 51 - Prof. Dr. Rainer Maurer
This diagram shows that in most of the 10-years averages a stock investment performed much better than an investment in a government bond. This higher average return of a stock investment is called the "stock premium". It is very often interpreted as the "risk premium" of a stock investment. - 52 - Prof. Dr. Rainer Maurer
This diagram shows that even though the 10-years average returns of a stock investment are significantly larger, the yearly returns of a stock investment fluctuate significantly more. The higher long-run return of a stock investment is therefore interpreted as a "risk premium". - 53 - Prof. Dr. Rainer Maurer
As a consequence of the stock premium, an investment of 1$ in the S&P-500 Portfolio in the year 1871 reaches an inflation adjusted value of 7044,3 $ in the Year 2007 (yearly average: 6,73 %). An investment of 1$ in US government bond in the year 1871 reaches an inflation adjusted value of 30,5 $ in the Year 2007 (yearly average: 2,54 %). - 54 - Prof. Dr. Rainer Maurer
2. Major Markets and Their Assets2.1.2. Stock Markets Key figures for stocks: The “price earnings ratio” (P/E ratio): Market price per stock = market value of the stock at period t = Pt Earnings per stock from the recent set of accounts = [(Profit after tax / number of stocks)] = [(Dividend payments + retained earnings) / number of stocks] (s. figure on slide 46 ) Example: Profit after tax = 30 million € Number of stocks = 10 million € Market price of stock = 60 € • => Price earnings ratio = 60 / (30/10) = 20 - 55 - Prof. Dr. Rainer Maurer
2. Major Markets and Their Assets2.1.2. Stock Markets Key figures for stocks: The “price earnings ratio” (P/E ratio): Interpretation: (1)If retained earnings pay off either in form of future dividend payments or future price gains, the P/E ratio is equivalent to the number of years a stock has to be hold in order to regain the money invested – if the earnings stay the same in all future periods. (2) The inverse of the P/E ratio is equivalent to the “Earnings yield”, i.e. to the long run yield per period that can be expected if the earnings in all future periods will be the same as the present earnings. Example: a P/E ratio of 20 is equivalent to an earnings yield of 1/20 = 5%. - 56 - Prof. Dr. Rainer Maurer