Download
1 / 1
10 likes | 178 Vues
Initial Results on the Variability of Sea Surface Salinity from Aquarius/SAC-D in the Gulf of Mexico Jorge Vazquez- Cuervo Jet Propulsion Laboratory/California Institute of Technology jorge.vazquez@jpl.nasa.gov

E N D
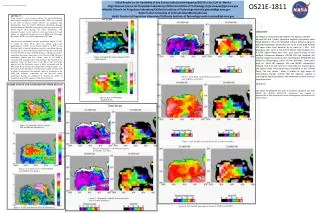
Initial Results on the Variability of Sea Surface Salinity from Aquarius/SAC-D in the Gulf of Mexico Jorge Vazquez-Cuervo Jet Propulsion Laboratory/California Institute of Technology jorge.vazquez@jpl.nasa.gov Michelle Gierach Jet Propulsion Laboratory/California Institute of Technology michelle.gierach@jpl.nasa.gov Robert Leben University of Colorado leben@colorado.edu VardisTsontos Jet Propulsion Laboratory/California Institute of Technology vardis.tsontos@jpl.nasa.gov OS21E-1811 National Aeronautics and Space Administration ABSTRACT Using version 1.3 of the Aquarius dataset, the spatial distribution and seasonal variability of sea surface salinity (SSS) was examined in the Gulf of Mexico (GoM). Results are compared with chlorophyll-a from the NASA MODerate Resolution Imaging Spectroradiometer (MODIS) on board the Aqua spacecraft over the period August 2011 through July 2012. Connections with dynamical features in the GoM (i.e., the Loop Current (LC) and eddies) are considered through the use of Multi-scale Ultra-high Resolution (MUR) sea surface temperature (SST) data. Statistics were calculated for the time period from August 25, 2011 to August 25, 2012. Mean values for salinity range from approximately 35 PSU in the Eastern GoM to 36 PSU in the Western GoM. A band of significant negative correlation between SSS and chl-a is observed running southeast from the Central Gulf Coast to the Western Coast of South Florida. A significant negative correlation also occurs along parts of the Western GoM. Negative correlations indicate that low salinity water in the GoM is associated with maximum chl-a concentrations. The location of the minimum along the Gulf Coast to the West Coast of Florida indicates that the freshwater source is likely associated with the Mississippi River and may be transported by GoM dynamics (i.e., the Loop Current and eddies). Seasonal maps of SSS and chl-a will be shown to corroborate the probable source of freshwater in the GoM and dynamics responsible for the observed spatial distribution. Results are significant in showing the ability of Aquarius to detect SSS signals in semi-enclosed basins. HYCOM CONCLUSIONS Correlations were performed between the Aquarius satellite derived SSS and (GoM). Significant negative correlations were found between SSS and chlorophyll-a Biases between Aquarius SSS and HYCOM SSS indicate that over much of the GoMHYCOM SSS were saltier than Aquarius by as much as 1 PSU. STD deviations over much of the Gulf of Mexico were between 0.2-0.3 PSU. Higher values were only seen close to areas of river outflow. Differences between HYCOM SSS and Aquarius SSS could be related to several reasons including that HYCOM SSS are driven by climatological values of river discharge. Time series plots of MUR SST, Aquarius SSS, and MODIS chlorophyll-a indicate that the Loop Current is responsible for entraining the low salinity water and transporting it westward to the Florida Coast. The low salinity water is related to high values of chlorophyll-a. Results indicate that the Aquarius satellite is resolving the signal associated with freshwater outflow from the Mississippi River. REFERENCES: FOR MORE INFORMATION ON HOW TO RETRIEVE AQUARIUS SSS DATA PLEASE SEE POSTER: OS21E-1796. Distribution and Support of Aquarius/SAC-D Data through the Physical Oceanography Distributed Active Archive Center Figure 4: Standard Deviation of Aquarius SSS - HYCOM SSS. Figure 8: Chlorophyll-a and SSS from Aquarius for day 9/30/2011 to 10/7/2011. CORELATIONS AND COMPARISONS WITH HYCOM Figure 5: Bias of HYCOM SSS - AQUARIUS SSS. Time Series Figure 1: Correlation between Aquarius SSS and MODIS chlorophyll-a Figure 3: Bias between HYCOM SSS – AQUARIUS SSS. Figure 9: SST and SSS from Aquarius for day 9/3/2011 to 9/9/2011. Figure 6: Chlorophyll-a and SSS from Aquarius for 9/6/2011-9/13/2011. Figure 2: Correlation between HYCOM SSS And MODIS chlorophyll-a. Figure 7: Chlorophyll-a and SSS from Aquarius for For 9/13/2011-9/20/2011. Figure 10: SST and SSS from Aquarius for day 9/17/2011 to 9/23/2011. Figure 3: Correlation between SST and chlorophyll-a