Download
1 / 8
80 likes | 167 Vues
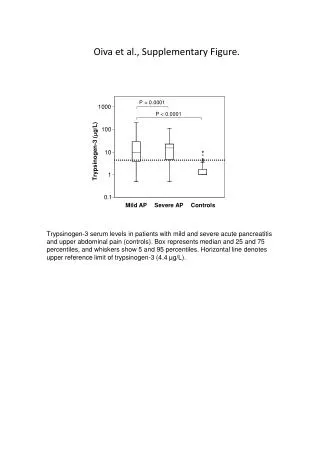
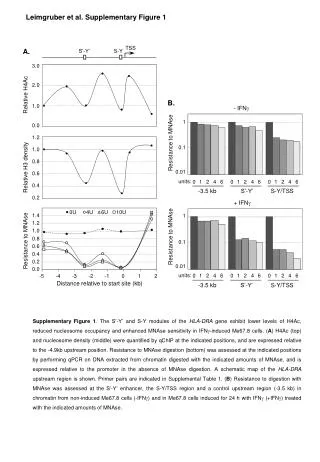
BrdU. DAPI/BrdU. 24 hrs. 24 hrs. 48 hrs. 48 hrs. 72 hrs. 72 hrs. Supplementary Figure 1. Suzuki et al. A. B. Supplementary Figure 2. Suzuki et al. p. CPD. H2AX. Merge. p. (6-4) photo. H2AX. Merge. p. XRCC1. H2AX. Merge. Supplementary Figure 3. Suzuki et al. No UV. 3 min.

E N D
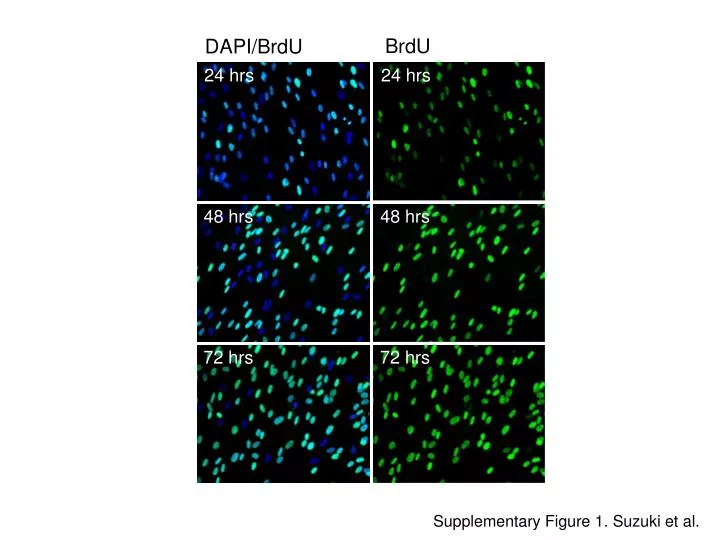
BrdU DAPI/BrdU 24 hrs 24 hrs 48 hrs 48 hrs 72 hrs 72 hrs Supplementary Figure 1. Suzuki et al.
A B Supplementary Figure 2. Suzuki et al.
p CPD H2AX Merge p (6-4) photo H2AX Merge p XRCC1 H2AX Merge Supplementary Figure 3. Suzuki et al.
No UV 3 min 5 min 10 min 20 min 0.5 hr Supplementary Figure 4. Suzuki et al.
Supplementary Table 1 BrdU treatment and foci formation Treatment No. of cells (%) BrdU (+) BrdU (+++) Foci+ BrdU-24 hrs 44.3 ± 11.9 15.1 ± 3.7 17.3 ± 17.5 BrdU-48 hrs 11.1 ± 5.6 51.4 ± 9.7 67.8 ± 21.4 BrdU-72 hrs 4.1 ± 0.9 85.9 ± 12.7 86.8 ± 17.2 BrdU-72 hrs 4.5 ± 1.1 85.7 ± 15.1 41.2 ± 15.3 + 1 mM APM Exponentially growing cells were labeled with 10 µM BrdU with or without 1 mM L-Ascorbic acid phosphate magnesium salt (APM) for various times as indicated. Cells with weak or strong BrdU signals were counted as BrdU (+) and BrdU (+++) cells, respectively. Approximately 3000 nuclei were examined. Data = mean ± SD.
Supplementary Table 2 Effect of BrdU treatment on foci formation Treatment % of cells with phosphorylated H2AX foci Without BrdU 2.9 ± 1.1 With BrdU 5.7 ± 1.9 Cells were incubated with or without 10 µM BrdU for 72 hours. Data = mean ± SEM
Supplementary Table 3 Foci formation in RPA-positive cells Treatment No. of cells (%) RPA+ Foci+ RPA+/Foci+ Density inhibition 3121 51 (1.6) 2787 (89.3) 49/2787 (1.8) Mitotic shake-off 357 7 (2.0) 310 (86.8) 7/310 (2.3) Exponentially growing cells were labeled with 10 µM BrdU for 72 hours. Then, they were subcultured at a high density for 5 days. Or, mitotic cells were collected by tapping the flasks.
Supplementary Table 4 Apoptosis induction by UVC exposure UVC dose Total no. cells No. of apoptosis-positive cells (%) (J/m2) counted 0 1000 8 (0.8) 20-12 hr 500 17 (3.4) 20-24 hr 500 57 (11.4) Exponentially growing cells were exposed to UVC without BrdU-labeling and were incubated for 12 or 24 hours. Apoptosis induction was determined by phosphorylated histone H2AX signal, as described by Mukherjee et al.