
Chapter 14 – Partial Derivatives
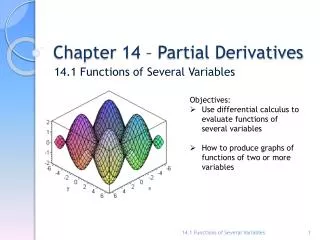
Chapter 14 – Partial Derivatives. 14.1 Functions of Several Variables. Objectives: Use differential calculus to evaluate functions of several variables How to produce graphs of functions of two or more variables. Remember. In general, we study functions from four points of view:

Chapter 14 – Partial Derivatives
E N D
Presentation Transcript
Chapter 14 – Partial Derivatives 14.1 Functions of Several Variables • Objectives: • Use differential calculus to evaluate functions of several variables • How to produce graphs of functions of two or more variables 14.1 Functions of Several Variables
Remember • In general, we study functions from four points of view: • Verbally (by a description in words) • Numerically (by a table of values) • Algebraically (by an explicit formula) • Visually (by a graph) • The same holds true for functions of two variables 14.1 Functions of Several Variables
Definition – Function of Two Variables We often write z=f(x,y) to make explicit the value taken on by f at the general point (x,y). That means, the variables x and y are independent variables and z is the dependent variable. 14.1 Functions of Several Variables
Arrow Diagrams • One way of visualizing such a function is by means of an arrow diagram, where the domain D is represented as a subset of the xy-plane. 14.1 Functions of Several Variables
Example 1 • Find and sketch the domain of the function given below. What is the range of f ? 14.1 Functions of Several Variables
Definition - Graphs • Another way to visualize the behavior of a function of two variables is to consider its graph. 14.1 Functions of Several Variables
Definition – Linear Function • A function in the form f(x, y) = ax +by +c is called a linear function. The graph of such a function has the equation z =ax +by +c or ax +by –z +c = 0 thus making it a plane. 14.1 Functions of Several Variables
Example 2 • Sketch the graph of the function below. 14.1 Functions of Several Variables
Graphs of functions in two variables • Here is a computer generated graph. • Notice that we get an especially good picture of a function when rotation is used to give views from different vantage points. 14.1 Functions of Several Variables
Example 3 • What is the range of Describe the graph of f. 14.1 Functions of Several Variables
Definition – Level Curves • So far we have two ways for visualizing functions: arrow diagrams and graphs. Our third method is borrowed from mapmakers and is called a contour map. This is made of contour curves or level curves. 14.1 Functions of Several Variables
Domain of Level Curves • A level curve f(x, y) = k is the set of all points in the domain of f at which f takes on a given value k. This means it shows where the graph of f has height k. 14.1 Functions of Several Variables
Level Curves • You can see from the figure the relation between level curves and horizontal traces. 14.1 Functions of Several Variables
Level Curves • The surface is: • Steep where the level curves are close together. • Somewhat flatter where the level curves are farther apart. 14.1 Functions of Several Variables
Visualization • Level Curves 14.1 Functions of Several Variables
Computer generated level curves Level curve Computer graphs 14.1 Functions of Several Variables
Visualization • Level Curves of a Surface 14.1 Functions of Several Variables
Function of Three Variables • A function of three variables, f, is a rule that assigns to each ordered triple (x, y, z) in a domain D R3 a unique real number denoted by f(x, y, z). 14.1 Functions of Several Variables
Functions of Three Variables • It’s very difficult to visualize a function f of three variables by its graph. • That would lie in a four-dimensional space. 14.1 Functions of Several Variables
Example 4 • Describe the level surfaces of the function below. 14.1 Functions of Several Variables
More Examples The video examples below are from section 14.1 in your textbook. Please watch them on your own time for extra instruction. Each video is about 2 minutes in length. • Example 6 • Example 8 • Example 11 14.1 Functions of Several Variables
Demonstrations Feel free to explore these demonstrations below. • Cross Sections of Graphs of Functions of Two Variables • Cobb-Douglas Production Functions • Graph and Contour Plots of Functions of Two Variables • Quadratic Surfaces 14.1 Functions of Several Variables