Download
1 / 19
190 likes | 458 Vues
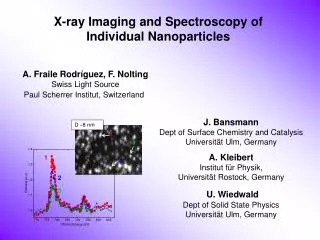
D 8 nm. 1. 3. 1. 2. 2. 3. X-ray I maging and S pectroscopy of I ndividual N anoparticles . A. Fraile Rodríguez, F. Nolting Swiss Light Source Paul Scherrer Institut, Switzerland. J. Bansmann Dept of Surface Chemistry and Catalysis Universität Ulm, Germany A. Kleibert

E N D
D8 nm 1 3 1 2 2 3 X-ray Imaging and Spectroscopy of Individual Nanoparticles A. FraileRodríguez, F. Nolting Swiss Light Source Paul Scherrer Institut, Switzerland J. Bansmann Dept of Surface Chemistry and Catalysis Universität Ulm, Germany A. Kleibert Institut für Physik, Universität Rostock, Germany U. Wiedwald Dept of Solid State Physics Universität Ulm, Germany
Magnetism in reduced dimensions Intrinsic properties Interparticle interactions Nanomagnetism Finite-size effects Size, aspect ratio distribution Surface effects
Magnetism in reduced dimensions Shape-dependent Thermal Switching Superparamagnetic Nanoislands Superparamagnetic limit: time and thermal stability M. Bode et al. Phys. Rev. Lett. (2004) 92 067201 Superparamagnetism
Magnetism in reduced dimensions Surface and core magnetic orders Surface effects spin glass? dead magnetic layer? bulk-like? • lower coordination number • broken magnetic exchange bonds • frustrated magnetic interactions • surface spin disorder • reduced M in ferri-, antiferro- systems • enhanced M in metallic ferro- systems • high-field irreversibilities • high saturation fields • shifted hysteresis loops
Ensembles vs Single-Particle Properties Ensembles: Distributions with respect to nanoparticle size, aspect ratio crystalline structure, defect distribution and chemical composition Courtesy of M. Farle, Uni Duisburg Single Particle experiments: Correlate the electronic, magnetic and structural properties with the size, aspect ratio, crystalline structure, and chemical composition of each individual particle. The ability to manipulate a single nanoparticle has an increased potential in device manufacturing
Soft x-ray Spectromicroscopy Magnetic Contrast: XMCD Chemical Selectivity Intensity (a.u.) Intensity (a.u.) atomic magnetic moments S Surface and interface sensitivity Magnetic Contrast: XMLD antiferromagnets chemical bonding electronic properties
Soft x-ray Spectromicroscopy Magnetization Direction S Element specific imaging: PEEM Co Py Substrate Co islands, 778.1 eV Py film, 852.7 eV 5 m
Energy Analyzer MCP Magnetic Lenses Phosphor 20kV x-rays Sample X-ray PhotoEmission Electron Microscopy • probing secondary/Auger/photoemission • spatial resolution: 50 nm • electron energy resolution: 0.1 eV • HA~ 30 mT • 100 K < T < 1500 K • ultra high vacuum
Cobalt particles: Arc ion cluster source R. P. Methling et al., EPJD 16, 173 (2001) • particle size tunable between 4-15nm • size distribution: DD/D ~10-15% • in situ deposition Collaboration with J. Bansmann, Uni Ulm, and A. Kleibert, Uni Rostock
100 nm 1 µm Particle Size: Scanning Electron Microscopy Co particles, no capping layer Co particles, Al capping layer D ~10 nm D ~ 8 nm • deposition of Co particles on Si substrates • coverage: 5-10 particles/m2 • lithographic markers on substrates • low percentage dimers/trimers • crystalline structure Lithographic markers: L. J. Heyderman, PSI
Photon energy 778 eV Photon energy 770 eV Image (778 eV)÷ Image (770 eV) 2 m 2 m 2 m Elemental Contrast: X-ray PEEM Co particles D 13 nm oxidized in air
X-ray Imaging of Individual Nanoparticles Co particles D 8 nm / 8 nm Al capping layer PEEM Elemental Contrast Scanning Electron Microscopy 1 µm 1 µm 1 µm 1 µm The lithographic markers are essential to correlate unambiguously the PEEM observations with the size of the particles imaged by the SEM Lithographic markers: L. J. Heyderman, PSI
particle/blank particle 1 m Intensity (a.u.) blank Individual Particles: X-ray Absorption Spectra Co particles D 8 nm, no capping layer 770 775 780 790 795 800 805 810 Photon Energy (eV) Movie: 159 images Total acquisition time: 12 hours.
X-ray Absorption: Particle-to-particle variation Co particles D 8 nm, no capping layer Reference CoO thin film B C B C D D A A E E Intensity (arb.units) Adapted from Regan et al. PRB 64 (2001) 214422 Particle 1 Particle 2 Particle 3
X-ray Absorption: Single-Particle vs Ensembles Co particles D 8 nm, no capping layer Reference CoO thin film Ensemble B C B D C D A A E Intensity (arb.units) E Adapted from Regan et al. PRB 64 (2001) 214422 Particle 1 Particle 2 Particle 3
Future: XMCD of individual nanoparticles • in situ Fe clusters (~ 9 nm) supported on ferromagnetic thin films 1 m Fe, 708 eV Co, XMCD, 778 eV Fe clusters Co film • alloy systems, e.g. FexCo1-x , FexPt1-x • Magnetic transition temperatures on the nanoscale
X-ray absorption spectra of individual Co particles as small as 8 nm • Differences in oxide-related features between individual particles were observed • Changes between the spectra of an individual particle and the ensemble were observed D8 nm 1 3 1 2 2 3 Conclusions
Collaborators F. Nolting, Swiss Light Source Paul Scherrer Institut, Switzerland J. Bansmann, Dept of Surface Chemistry and Catalysis Universität Ulm, Germany A. Kleibert, Institut für Physik, Universität Rostock, Germany U. Wiedwald, Dept. Solid State Physics, Universität Ulm, Germany L. J. Heyderman,Laboratory for Micro- and Nanotechnology Paul Scherrer Institut, Switzerland