Download
1 / 1
10 likes | 127 Vues
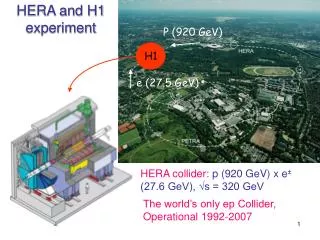
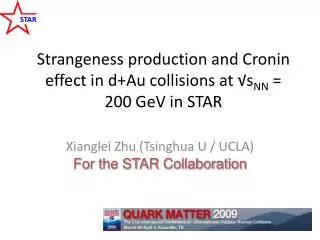
p(p). V 0. Beam p. π ( K ). Ξ ( Ω ). A. π. Δ z / γ. 2. 2. p. p [GeV ]. HERA-B. K 0 S. 3414.6 +/- 2.3 k. t. √ s = 41.6GeV. V 0. -. π. Beam p. Beam 920 GeV/ c protons. Subdetectors used in the present study:. The HERA-B Experiment at DESY. A.

E N D
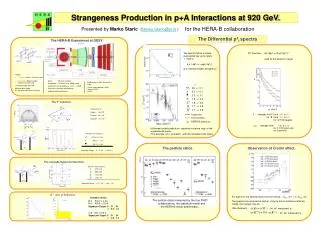
p(p) V0 Beam p π(K) Ξ(Ω) A π Δz /γ 2 2 p p [GeV ] HERA-B K0S 3414.6 +/- 2.3 k t √s = 41.6GeV V0 - π Beam p Beam 920 GeV/c protons Subdetectors used in the present study: The HERA-B Experiment at DESY A Acceptance – 15-160(v) resp. 250(h) mrad + + Ξ Ξ and mostly at mid rapidity (xF -0.15 – +0.05) • Silicon vertex detector (SVD) • Tracker (OTR) • RICH High mass resolution spectrometer Δz /γ + Good particle identification Λ Λ Ω K0S 3.0 +/- 0.1 Λ 2.2 +/- 0.1 2.2 +/- 0.1 Ξ- 1.8 +/- 0.2 1.8 +/- 0.2 Ω- 1.7 +/- 0.6 Interactions at: : (GeV/c) 1.7 +/- 0.8 Carbon 76.6 106 Titanium 24.1 106 - HERA-B preliminary Tungsten 71.6 106 The particle ratios measured by the four RHIC collaborations, the statistical model and the HERA-B result (preliminary). K-π+ 410.9 ± 3.0 k K+K- 52.6 ± 0.4 k Strangeness Production in p+A Interactions at 920 GeV. for the HERA-B collaboration Presented by Marko Staric (Marko.Staric@ijs.si ) The Differential p2t spectra The spectra follow a simple exponential law up to nearly 1. GeV/c: Fit function: dσ /dpt2 ∞ (1+pt2/p02)-β valid for the whole pt2 range d σ / dp2t ∞ exp(-Bp2t) and becomes flatter at higher p2t. • Targets: • Feature : works in the beam halo σ • Advantage : different target materials may be used B • 1 kHz data acquisition rate. • Minimum bias trigger • 0.1 interaction per bunch crossing The V0 selection. B β : changes for K* from 3.8 to 4.7 forΦfrom 3.8 to4.2 for C:Ti:W targets <pt> : changes from0.64 to 0.73 for C:Ti:W targets and for all particles Experiment Thermal Model • A thermal model predicts an opposite curvature resp. to the • experimental curve. • The average <p2t> increases with the increase of the mass. Statistics (this analysis) : Λ 705.3 +/- 1.1 k 338.7 +/- 0.8 k Observation of Cronin effect. The particle ratios. Signal per Target - C : Ti : W - 1 : 0.4: 2.2 The Cascade Hyperons Selection. Statistics (this analysis): Ξ- 4778 ± 78 3098 ± 63 444 ± 35 Ω- + 378 ± 27 Ω Signal per Target - C :Ti : W - 1 : 0.3 : 1.9 For each bin, the spectra were fit to the formula: dσpA /dp2t = Aα dσpp /dp2t Statistics (final): The spectra are enhanced at high p2t may be due to multiple scattering inside the nucleus may be ….. K+π- 533.2 ± 3.2 k Signal per Target: C : Ti : W 1. : 0.4 : 1.4 We observed: , for all measured p t , for all measured p t Signal per Target: C : Ti : W 1. : 0.5 : 1.7