Download

1 / 32
320 likes | 499 Vues
Evaluating satellite ocean color-derived export production in the Southern Ocean using atmospheric O 2 /N 2 data. Cindy Nevison University of Colorado Mati Kahru, Ralph Keeling, Manfredi Manizza, B. Greg Mitchell Scripps Institution of Oceanography Matt Charette, Kanchan Maiti

E N D
Evaluating satellite ocean color-derived export production in the Southern Ocean using atmospheric O2/N2 data Cindy Nevison University of Colorado Mati Kahru, Ralph Keeling, Manfredi Manizza, B. Greg Mitchell Scripps Institution of Oceanography Matt Charette, Kanchan Maiti Woods Hole Oceanographic Institution Acknowledgements: NASA NNX08AB48G, Michael Bender, Nicolas Cassar, Ray Langenfelds, N2O and CFC-12 data from AGAGE, NOAA CCGG and CSIRO
Outline • Export Production from Ocean Color 2) Atmospheric O2/N2 Data 3) Decomposition of O2/N2 seasonal cycle into Component Signals (land, thermal, ventilation, production) 4) Atmospheric Transport Model Uncertainty – APO Transcom Experiment
Improved Chl-a Algorithm for Southern Ocean B.G. Mitchell et al.
NPP estimated from Ocean ColorModified Behrenfeld and Falkowski = f(Surface T, Chl-a, PAR) Palmer LTER data using SPGANT algorithm (Kahru and Mitchell)
Export Production = ef*NPPexport fraction (ef) = f(NPP, SST) Southern Ocean in situ data compiled from the literature (Maiti et al.)
Export Production from Ocean Color Global South of 50S 18 Pg C/yr 1.6 Pg C/yr (Unmodified Laws model for ef)12 Pg C/yr 1.0 Pg C/yr (Laws scaled to Schlitzer, 2002) Atmospheric O2/N2 Monitoring StationsSIO (R. Keeling), Princeton (M. Bender, N. Cassar)
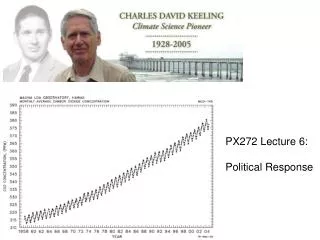
Atmospheric O2/N2: Decreasing Trend and Seasonal Cycles per meg Bender et al., 2005
Atmospheric Potential Oxygen: Barrow, AlaskaRemove Land Signal from O2/N2 using CO2 data O2/N2 APO
Wintertime Ventilation O2 Flux 8 Thermocline Ventilation O2 Flux 4 Deep Water Ventilation O2 Flux 3 Atmosphere O2 Flux 15 Euphotic Zone Production 100 Consumption 80 O2 Flux 5 Corg 20 Base of Seasonal Thermocline Consumption 10 Corg 10 O2 Flux 3 Main Thermocline Consumption 8 Corg 2 O2 Flux 1 Consumption 1 Deep Ocean O2 Flux 1 What causes Seasonal Cycles in APO?How are they linked to carbon export production? Export Production Adapted from Keeling et al., 1993 Corg 1 to sediment
APO Seasonal Cycle at Cape Grim, TasmaniaCompare to MATCH:NCEP transport model run with satellite-derived export fluxassume 1.4 mole O2 released per mole C exported APOobserved = APOthermal + APOnet_biological = APOthermal + APOdeep_ventilation+ APOsurface_production
Thermally Corrected APO Seasonal Cycle at CGO Thermal cycle estimated based on Ar/N2 data or QST/Cp (need ATM)
APO Seasonal Cycle at Cape Grim, TasmaniaCompare to MATCH:NCEP transport model run with satellite-derived export flux APOobserved = APOthermal + APOnet_biological = APOthermal + APOsurface_production + APOdeep_ventilation
Estimation of APO ventilationsignal based on atmospheric N2O dataAGAGE data from Cape Grim, Tasmania
Correlated Changes in Atmospheric N2O and APO during Coastal Upwelling Events at Trinidad HeadLueker et al., 2003 APO N2O is produced during subsurface remineralization, but not affected by euphotic zone primary production N2O Grey Band is Upwelling Event
N2O and O2 are Anticorrelated in Ocean Depth Profiles DN2O/AOU ratio is well defined Southern Ocean data from Brian Popp and Tom Trull
The DN2O/AOU molar ratio in the subsurface ocean is reflected in observed DN2O/DAPO atmospheric variations during coastal upwelling events Lueker et al., 2003
Decomposition of APO and N2O Seasonal Cycles at Cape Grim, Tasmania N2O APO thermal + stratospheric + ventilation thermal + ventilation + production
Compare Decomposed APO Seasonal Cycle at Cape Grim to MIT Ocean Model Results M. Manizza
N2O Seasonal Cycles in Individual Years at Macquarie Island (CSIRO Data)
Separating Stratospheric and Oceanic N2O Signals at Macquarie Island
Decomposition of APO and N2O Seasonal Cycles at Macquarie Island N2O APO thermal + ventilation thermal + ventilation + production
Decomposition of APO Seasonal Cycle at Palmer Station, Antarctica 30 per meg * 0.2095 * 10-6 = DO2/N (moles O2/moles dry air) But what is N? Some fraction of 1.77 x 10²⁰ total moles dry air
Atmospheric Transport Model (ATM) Uncertainty Evaluation of oceanic O2 fluxes based on observed APO seasonal cycles or latitudinal gradient, e.g., Naegler et al. [2007] Conclusion: These evaluations are difficult because shortcomings in ATMs and problems of data representativity cannot be distinguished from uncertainties in the O2 fluxes.
APO Transcom Experiment (Blaine, 2005) 9 atmospheric transport models forced with Garcia and Keeling [2001] monthly oceanic O2 and N2 flux anomalies. Below: APO seasonal cycles at Cape Grim, Tasmania
APO Transcom Seasonal Amplitude vs. Vertical Gradient at four Southern Hemisphere Stations Red dotted line is observed APO amplitude Summer Winter
APO Transcom Vertical Profiles near Cape Grim, Tasmania vs. CSIRO Aircraft Data Summer Winter Data courtesy of Ray Langenfelds
Conclusions 1) Satellite ocean color data: uncertainties compounded in the sequence from Chl-a to NPP to Export Production. 2) Partitioning of net biological APO signal into surface production and deep ventilation: Atmospheric N2O-based method, MIT ocean model and satellite ocean color data converge on similar answer. 3) Can now compare surface production signal in APO directly to export production from ocean color, but some major uncertainties: 1) Need for atmospheric transport model as intermediary 2) N2O cycle decomposition – thermal and stratospheric signals
Southern Ocean CO2 Sinkand Biological Pump Takahashi et al., 2009 CO2 Flux Export Production from Ocean Color Satellite 14º-50ºS sink = 1.05 Pg C/yr
Southern Ocean as Source and Sink of CO2. Note scale difference Lovenduski et al., 2007
Components of net biological signal in APO: Three Possible Views observed – thermal = net biological= production + ventilation MIT Ocean Model Results from M. Manizza
APO at Cape Grim, TasmaniaRemove Land Signal from O2/N2 using CO2 data O2/N2 APO