SmartMart: IOT-Based Indoor Mapping for Efficient Shopping Experience
SmartMart is an innovative IOT-based mobile application designed to enhance the in-store shopping experience. By leveraging RFID technology, it continuously tracks the location of store items, allowing users to search and map products on a digital floor plan using their mobile devices. This app facilitates route recommendations and personalized searches, making it easier for shoppers to locate multiple items quickly. Unlike existing shopping apps, SmartMart provides dynamic location-based services, improving customer satisfaction and streamlining the shopping process.

SmartMart: IOT-Based Indoor Mapping for Efficient Shopping Experience
E N D
Presentation Transcript
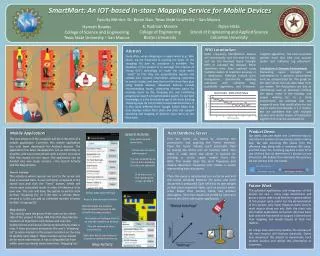
SmartMart: An IOT-based In-store Mapping Service for Mobile Devices Faculty Mentor: Dr. Byron Gao, Texas State University – San Marcos Dylan Hicks School of Engineering and Applied Science Columbia University K. Rodman Mannix College of Engineering Boston University Hannah Bowles College of Science and Engineering Texas State University – San Marcos RFID Localization Radio Frequency Identification devices will continuously scan the area for tags, and use the Received Signal Strength (RSS) to calculate the distance. Many algorithms have been explored using multiple readers to maximize accuracy in 2 dimensions. Methods include basic triangulation, dynamically updating calibration with reference tags, probability algorithms, and K-nearest- neighbor algorithms. The most successful systems must also take into account reader and reference tag placement. Calculations in Dynamic Environments Fluctuating signal strengths and interference in a dynamic environment must be compensated for. The graph on the right shows the raw data taken from our reader. The fluctuations are due to interference such as doorways catching the signal, metal in the building, and people walking by. In a store environment, we estimate that the margin of error that would allow for our app to retain functionality is 1-2 meters. We are confident that with multiple readers and careful choice of localization algorithms this can be accomplished. Abstract Quite often, when shopping in a supermarket (e.g., Wal-Mart), we are frustrated at locating the items on the shopping list and no assistance is available. The objective of this project is to leverage the Internet of Things (IOT) technology to make the store items ``smart" so that they can automatically register and update their location information, allowing customers to search, locate, and map them on the store floor plan using mobile devices. Advanced features include recommending routes, computing shortest paths for multiple items on the shopping list, and facilitating progressive search and personalized search. To our best knowledge, it is the first mobile app of this kind. Existing shopping apps do not provide location-based services. It is also quite different from Google Indoor Maps that only displays indoor floor plans and does not support searching and mapping of dynamic store items on the floor plan. Product Demo Item Database Server Search Activity Our demo uses one reader and 2 reference tags to calculate the location of two sample active tracking tags. We take incoming RSS values from the reference tags along with a maximum RSS value, and find linear fits. Incoming tag data is then fit to one of those lines to determine it’s location in one dimension. We believe this maximizes the accuracy we can achieve with one reader. The end-product of this research will be in the form of a mobile application. Currently, this mobile application has only been developed for Android devices. The application has been developed to run as efficiently as possible, and can communicate with a server to receive XML files based on user input. The application can be divided into two major screens – the Search Activity and the Map Activity. Search Activity This activity is where queries are sent to the server and data is received back. A user will enter a keyword in the search box and click the “Send” button, which will return each associated result in order of relevance in its own row. The user will have the option to add an item to their ‘shopping list,’ or if the item is already there, remove it. Users can add an unlimited number of items to their ‘shopping list.’ Map Activity This activity does the grunt of the work on the client-side of this project. It takes XML files that describe the locations of map floors and shelves and uses the Android Draw and Canvas classes to dynamically draw a map. It then processes and parses the user’s ‘shopping list’ to place markers in the proper locations on the map to identify each object. These markers can be clicked on for more information. It has a collapsible list from which users can delete items from their ‘shopping list.’ First the terms are found by removing the punctuation and applying the Porter stemmer. Then the server indexes each searchable field by placing the terms into an inverted index. This index is used when the server is queried by creating a vector space model from the data. Thismodel takes the term frequency and inverse document frequency and creates a vector representing each document. Then, the query is represented as a vector as well and the cosine similarity between the query and each document is computed. Each field has its own weight so that more important fields, such as product name, score better than tertiary fields, like product description. Then the results are sorted by score and sent to the client side mobile application. User enters search terms here Mobile Application Initiates server query with keyword If a user already has an item in their shopping list, they can remove it Known RSS at this point reader Ref1 Ref2 RSS = Slope1 * Dist + B1 RSS = Slope2 * Dist + B2 If an item is not in the shopping list, a user can add it Yellow areas mark the floor Areas in blue represent shelves Red rectangles are markers that represent the items in the list with the same number Future Work The potential applications and integration of this project are vast – many large department and grocery stores alike could find the implementation of this project quite useful. For the demonstration of this project, only linear distances were used to mark objects along one axis. Both the client side (the mobile application) and server side have been built with the framework to support 2-dimensional item mapping, but would require at least two readers. On a large scale with many readers, the accuracy of the item location will improve drastically. Stores may implement this project to dynamically track product location and deliver this information to customers. This button will collapse the list so only the header can be seen This will remove all items from the list Each item has its own row and a button to delete from the list Map Activity
Hannah Bowles College of Science and Engineering Texas State University – San Marcos RSS = Slope1 * Dist + B1 Dylan Hicks School of Engineering and Applied Science Columbia University HELLO