Three groups of DZ twins
220 likes | 406 Vues
Can resemblance (e.g. correlations) between sib pairs, or DZ twins, be modeled as a function of DNA marker sharing at a particular chromosomal location?. Three groups of DZ twins. IBD = 2 (all markers identical by descent) IBD = 1 IBD = 0

Three groups of DZ twins
E N D
Presentation Transcript
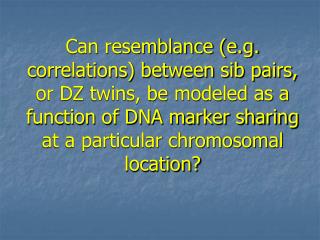
Can resemblance (e.g. correlations) between sib pairs, or DZ twins, be modeled as a function of DNA marker sharing at a particular chromosomal location?
Three groups of DZ twins • IBD = 2 (all markers identical by descent) • IBD = 1 • IBD = 0 Are the correlations (in e.g. lipid levels) different for the 3 groups?
A fully informative mating marker QTL offspringIBD = 2 distance Sib1ACBD Sib2ACBD offspringIBD = 1 Sib1ACBD Sib2ADBC offspringIBD = 0 Sib1AC Sib2BD mother father D A B C X Q? Q? Q? Q?
Identity By Descent (IBD) status in siblings. Four parental marker alleles: A - B and C - D. Two sibs can inherit 0, 1 or 2 alleles IBD. IBD 0 : 1 : 2 = 25% : 50% : 25% Derivation of IBD probabilities for one marker (with and without parental genotypes known) was given by Haseman and Elston (1972). Applications: affected sib-pair method linkage with quantitative traits
Adult Dutch DZ pairs: distribution of pi-hat (π) at 65 cM (chromosome 19). π = IBD/2; all pairs with π <0.25 have been assigned to IBD=0 group; all pairs with π > 0.75 to IBD=2 group; others to the IBD=1 group.
Exercise • Model DZ correlation in LDL as a function of IBD • Test if the correlations are the same • Add data of MZ twins • Test if the correlation in the DZ group with IBD = 2 is the same as the MZ correlation • Repeat for apoB and ln(apoE) levels • Does eliminating subjects who are on lipid-lowering medication change the results? • Do cross-correlations (across twins/across traits) differ as a function of IBD? (trivariate)
Basic script and data (LDL, apoB, apoE) • Correlation estimation in DZ: BasicCorrelationsDZ(ibd).mx • Information on data: datainfo.doc • Datafiles: DZ: partionedAdultDutch3.dat MZ: AdultDutchMZ3.dat • Complete (MZ + DZ + tests) job: AllCorrelations(ibd).mx
Correlations as a function of IBDIBD2 IBD1 IBD0 MZLDL 0.81 0.49 -0.21 0.78ApoB 0.64 0.50 0.02 0.79lnApoE 0.83 0.55 0.14 0.89
Correlations as a function of IBDchi-squared tests all DZ equal DZ(ibd2)=MZLDL 21.77 0.0975apoB 7.98 1.53apoE 12.45 0.576(df=2) (df=1)
Can heritability be modeled as a function of DNA marker sharing at a particular chromosomal location?
DZ twin pairs who are IBD = 2: familial and QTL effects r = 1 E E r = 1 e e F F f f Q Q q q DZ 1 DZ 2
DZ twin pairs who are IBD = 1: familial and QTL effects r = 1 E E r = 0.5 e e F F f f Q Q q q DZ 1 DZ 2
DZ twin pairs who are IBD = 0: familial effects r = 1 E E e e F F f f DZ 1 DZ 2
Linkage analysis in DZ twins or sib pairs 3 groups: IBD=2,1,0 (π=1, 0.5, 0) Model the covariance as a function of IBD Allow for background familial variance Total variance also includes E Covariance = πQ + F + E Variance = Q + F + E
MZ Twin pairs rMZ = 1 rMZ = 1 E E rMZ = 1 C C e e A A c c a a Q Q q q MZ 1 MZ 2
rMZ = rDZ = 1 rMZ = 1, rDZ = 0.5 E E rMZ = 1, rDZ = 0, 0.5 or 1 C C e e A A c c a a Q Q q q Twin 1 Twin 2 4 group linkage analysis (3 IBD DZ groups and 1 MZ group)
Exercise • Fit FQE model to DZ data (i.e. F=familial, Q=QTL effect, E=unique environment) • Fit FE model to DZ lipid data (drop Q) • Is the QTL effect significant? • Add MZ data: ACQE model (A= additive genetic effects, C=common environment), does this change the estimate / significance of QTL?
Basic script and data (LDL, apoB, apoE) • FQE model in DZ twins: FQEmodel-DZ.mx • Information on data: datainfo.doc • Datafiles: DZ: partionedAdultDutch3.dat MZ: AdultDutchMZ3.dat • Complete (MZ data + DZ data + tests) job: ACEQ-mzdz.mx
Test of the QTL: chi-squared test(df = 1) DZ pairs DZ+MZ pairsLDL 12.247 12.561apoB 1.945 2.128 apoE 12.448 12.292
Use pi-hat: single group analysis (DZ only) rDZ = 0.5 E E ^ rDZ = e e A A a a Q Q q q Twin 1 Twin 2
Exercise: PiHatModelDZ.mx • Chi-square (LDL) = 12.318
rMZ = rDZ = 1 rMZ = 1, rDZ = 0.5 E E ^ rMZ = 1, rDZ = C C e e A A c c a a Q Q q q Twin 1 Twin 2