Download
1 / 1
10 likes | 135 Vues
South Pole. Spectral Analysis. Why is it important?. Abstract. Cloud cover. Time series. Conclusions. Table 1. Compensating biases in seasonal components of the surface energy budget over the South Pole.

E N D
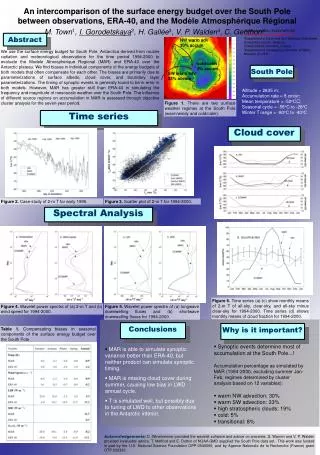
South Pole Spectral Analysis Why is it important? Abstract Cloud cover Time series Conclusions Table 1. Compensating biases in seasonal components of the surface energy budget over the South Pole An intercomparison of the surface energy budget over the South Pole between observations, ERA-40, and the ModèleAtmosphérique Régional M. Town1, I. Gorodetskaya2, H. Gallée3, V. P. Walden4, C. Genthon3 1Seattle University, Seattle WA USA (michael.s.town.atmos@gmail.com) 2Department of Earth and Env Sciences,Katholieke Universiteit Leuven, Belgium 3LGGE/CNRS,Grenoble, France 4Department of Geography,University of Idaho, Moscow, ID USA NW warm adv 30% accum We use the surface energy budget for South Pole, Antarctica derived from routine radiation and meteorological observations for the time period 1994-2000 to evaluate the Modele Atmospherique Regional (MAR) and ERA-40 over the Antarctic plateau. We find biases in individual components of the energy budgets of both models that often compensate for each other. The biases are primarily due to parameterizations of surface albedo, cloud cover, and boundary layer parameterizations. The timing of synoptic events is generally found to be in error in both models. However, MAR has greater skill than ERA-40 in simulating the frequency and magnitude of mesoscale weather over the South Pole. The influence of different source regions on accumulation in MAR is assessed through objective cluster analysis for the seven-year period. cold/calm 5% accum SW warm adv 33% accum Altitude = 2835 m; Accumulation rate = 8 cm/yr; Mean temperature = -50oC Seasonal cycle = -58oC to -28oC Winter T range = -80oC to -40oC Figure 1. There are two surface weather regimes at the South Pole (warm/windy and cold/calm). Figure 2. Case-study of 2-m T for early 1995. Figure 3. Scatter plot of 2-m T for 1994-2000. d. cloud fraction Figure 6. Time series (a)-(c) show monthly means of 2-m T of all-sky, clear-sky, and all-sky minus clear-sky for 1994-2000. Time series (d) shows monthly means of cloud fraction for 1994-2000. Figure 4. Wavelet power spectra of (a) 2-m T and (b) wind speed for 1994-2000. Figure 5. Wavelet power spectra of (a) longwave downwelling fluxes and (b) shortwave downwelling fluxes for 1994-2000. • Synoptic events determine most of accumulation at the South Pole...! Accumulation percentage as simulated by MAR (1994-2000, excluding summer Jan-Feb, regimes determined by cluster analysis based on 12 variables): • warm NW advection: 30% • warm SW advection: 33% • high stratospheric clouds: 19% • cold: 5% • transitional: 8% • MAR is able to simulate synoptic variance better than ERA-40, but neither product can simulate synoptic timing. • MAR is missing cloud cover during summer, causing low bias in LWD annual cycle. • T is simulated well, but possibly due to tuning of LWD to other observations in the Antarctic interior. Acknowledgements: D. Winebrenner provided the wavelet software and advice on wavelets. S. Warren and V. P. Walden provided invaluable advice. T. Mefford and E. Dutton of NOAA GMD supplied the South Pole data set. This work was funded in part by the U.S. National Science Foundation OPP-0540090, and by Agence Nationale de la Recherche (France) grant OTP 232333.