Bond Portfolio Management: Extra
This article explores how to identify misalignment in bond yields of different maturities, focusing on the 1-year, 5-year, 10-year, and 30-year yields. Utilizing the Cox-Ingersoll-Ross (CIR) model, we assess the relationship between T-year yields and short-term rates. With today's short-term rate at 4.6% and various yields provided, this analysis highlights significant deviations, particularly between the 10-year and 30-year bonds. We suggest a trading strategy of shorting 30-year bonds while going long on 10-year bonds, considering potential convergence and related risks.

Bond Portfolio Management: Extra
E N D
Presentation Transcript
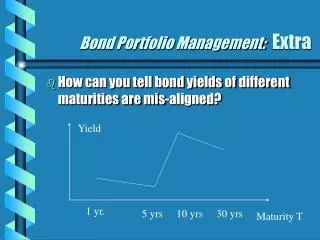
Bond Portfolio Management: Extra • How can you tell bond yields of different maturities are mis-aligned? Yield 1 yr. 5 yrs 10 yrs 30 yrs Maturity T
Example:Cox-Ingersoll-Ross Model • The price of a T-yr zero-coupon bond should be:
T-yr Yield according to CIR • T-yr yield and short-term rate must be related to each other according to
Example • Parameter values: • k = 0.5 r = 0.02 v = 3% • Today’s short-term rate: R = 4.6%1-yr yield = 5.2% 5-yr yield = 5.7%10-yr yield = 5.9% 30-yr yield = 6.05%
Example continued • According to the CIR: the yields should be as follows:
Example continued 30-yr
Strategy Implications • From chart, • The diff. between actual and CIR yields is larger for 10-yr than for 30-yr ! • If CIR curve is true, then • Short the 30-yr bonds • Long the 10-yr bonds • counting on an eventual convergence between actual and CIR curves!
Risks in Strategy • Interest-Rate risk: • Duration-matching will take care of some. • Model risk: • What if the model is wrong?