Bear Trap
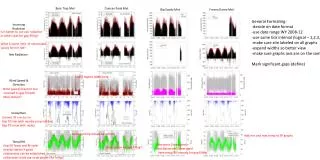
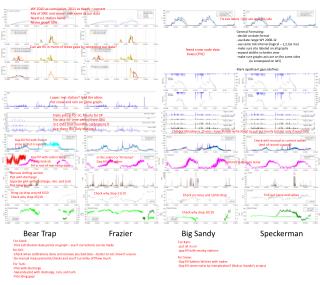
WY 2010 as cumulative, 2011 as depth – convert Mix of SWE and snow - use same as our data Need ss1 station name Revise graph title. Fix axis labels – put axis on each side. General Formating : -decide on date format -use date range WY 2008-12

Bear Trap
E N D
Presentation Transcript
WY 2010 as cumulative, 2011 as depth – convert Mix of SWE and snow- use same as our data Need ss1 station name Revise graph title Fix axis labels – put axis on each side General Formating: -decide on date format -use date range WY 2008-12 -use same tick interval (logical – 1,2,3,6 mo) -make sure site labeled on all graphs -expand widths so better view -make sure graphs axis are on the same sides (iesnowspeed on left) Mark significant gaps (define) Can we fill in more of these gaps by correcting our data? Need snow node data boxes (Phil) Lower met station? Add the other. Put snow and rain on same graph. Daily precip for LC, hourly for SP No data for time period from GKS Ss1 data bad (monthly calibrations?) Are these the only stations? Chilkoot Meadow in 15 min – have Xiande write script to pull out hourly (totals) only if need data Gap fill YSI with Frazier since solinst is suspect Check with manual or current values (end of record suspect) Gap fill with solinst temp if data look ok Fill in rest of met temp data Is this solinst or YSI temp? Gap fill with other Add met station air temp Remove drifting section Plot with discharge Separate plot with discharge, rain, and turb Plot Iding gaps Bring up drop around 6/10 Check why drop 11/10 Check why drop 11/10 Pull out noise and spikes Check on noise and 10/10 drop Check why drop 10/10 Bear Trap Frazier Big Sandy Speckerman For Cond: -Plot salt dilution data points on graph – see if corrections can be made For Rain: -put all in cm -gap fill with nearby stations For DO: -Check when calibrations done and remove any bad data – better to not show if unsure -Do manual measurements/checks and see if currently off/how much For Snow: -Gap fill battery failures with nodes -Gap fill storm noise by interploation? (Bob or Xiande’s scripts) For Turb: -Plot with discharge -Separate plot with discharge, rain, and turb -Plot Iding gaps