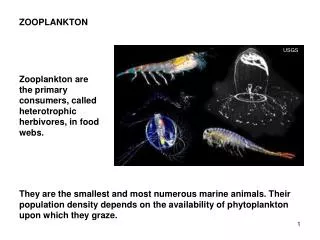
Mostly Zooplankton
Mostly Zooplankton. Bill Peterson and Rian Hooff NOAA-Fisheries, Newport OR Washington State University, Vancouver WA. My conclusions. If I didn’t know better, I would conclude that the coastal ecosystem of the Pacific Northwest was struck by a major El Niño event in 2005.

Mostly Zooplankton
E N D
Presentation Transcript
Mostly Zooplankton Bill Peterson and Rian Hooff NOAA-Fisheries, Newport OR Washington State University, Vancouver WA
My conclusions • If I didn’t know better, I would conclude that the coastal ecosystem of the Pacific Northwest was struck by a major El Niño event in 2005. • But there was no El Niño event in 2005; warming was due to delayed upwelling. • But if things were that simple, the ecosystems effects should not have been so severe • Hypothesis: severity a result of three years of stress on the ecosystem, initiated in fall 2002
Astoria 4 6 ° N Tillamook 4 5 ° N + + + + Newport 50m 100m 4 4 ° N 150m Coos Bay 4 3 ° N 4 2 ° N 125° W 124° W 123° W • NH-Line Hydrographic and Zooplankton • Time Series 100m 50m • Bi-weekly Sampling: • 1969 – 1973 (Miller, Pearcy, Peterson) • 1983 (Miller, Batchelder, Pearcy, Brodeur) • 1996 – present (Peterson et al.) • = NOAA Buoy 46050 NH Line
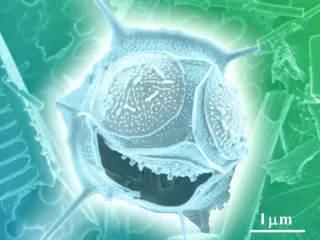
SST anomalies at NOAA Buoy 46050: 1996-2005 • Summers of 2003, 2004 and 2005 had SST anomalies similar to those observed during the 1997/98 El Niño • Exact same result shown for all Canadian buoys, both inshore and offshore The ocean began to cool in autumn 1998 and warm in autumn of 2002, coincident with the changes in sign of the PDO. Warming has continued for the past 3 years.
Temperature and Anomaly along NH line 28 May 2005 May, Jun, Aug, Nov 2004 • 30 m thick slab of warm water • at the surface • 10 deg isotherm 80 m v 50 m • Isotherms displaced ~ 25 m • deeper as compared to 2004
T-S Time Series, 150 m depth, shelf break station off Newport, NH 25 • Seasonal cycle apparent • Since 2001, increased temperature in both summer and winter • Salinity decreased by 0.2 in late 2003 and 2004; true also for Monterey and S. Calilfornia • Salinity increased beginning in August 2005
Nitrate and Silicate at 150 m depth at shelf break station off Newport • Possible decline in silicate in 2004; same true for CalCOFI • Possible decline in nitrate in 2004? • We are a little light on recent data due to lack of funding for continuation of LTOP work • Adding water sample at 150 m on future Elakha cruises.
Chl-a NH 05 • 2001-2004 had highest average Chl in both summer and May-July period • 2005 the lowest May-July SUMMER
Copepod Biomass • Seasonal cycle apparent • Low biomass during warm phase of PDO 1996-1998, and during first year of negative PDO (1999) • Doubling of biomass during cool phase of PDO, 2000-2002. High values continued into first two years of positive PDO (2003, 2004). • Values observed in 2005 were 0.4x of 2000-2004 and 0.7x of 1996 -1998
Climatology (BARS) Data (LINES) Seasonal cycle
Copepod Biomass Anomalies: El Niño or not an El Niño?1998 and 2005 very similar 2005 Month Factor Low • April 1.4 • May 2.5 • June 3.3 • July 2.5 • Aug 1.6 • Sep 2.5
The summer of 2005 had the lowest copepod biomass of all measurements made over 18 years.
PDO vs. Northern and Southern Copepods • 2005 had a negative anomaly of northern copepods similar to 1998 El Niño • 2005 had one of the largest positive anomalies of southern species
Copepod species richness anomaly at NH 05 • PDO and MEI correlated with species richness • Time lags exist but are variable. • Species richness declined in fall 1998 but began to increase in Nov 02 • Richness values now exceed both the 83 and 97 El Niño events Species richness continued to be high through summer 2005
Euphausiid eggs • Spawning poor 1996-1999, intense in 2000 and during 2001-2004. Very low in 2003 and 2005 at inshore station, but ~ normal at NH 15 and NH 25.
Euphausiids: shelf break (NH 25)E. pacifica (upper) T. spinifera (lower) • Variations in abundance are large. Always low in July and highest in late summer or fall. • 2005 not unusual other than there were few T. spinifera in 2004 or 2005
Other observations • Velella common in 2005 (as in 2004) • Bob Loeffel, retired ODFW, walks a mile of the beach just south of Newport every week; he notes all that he sees; the number of dead murres in June was the most he has seen in 23 years. • Russ Hopfcroft reports two warm water copepod species on GAK line this summer, Paracalanus and Clausocalanus. • Dave Ainley reports three new records for pelagic birds in S. California – each was from the Humboldt Current. Also the Ross Sea is “weird” this summer. • More to come in following talks
2005: looked like an El Niño • Waters are warm and fresh both on shelf and in the undercurrent • Extremely low copepod biomass • Due to collapse of the food chain, juvenile salmon survival was very low • Thousands of birds died (Cassin’s auklets, murres and cormorants) • But…the equator was in a neutral-to-weak El Niño state! • Silver Lining Hypothesis: murres decimated, so next year, regardless of ocean conditions, predation pressure on salmon will be reduced.
An ecological problem • What Frank and I thought was a regime shift in 1998 has completely fizzled. So much for the 20-year cycles….. • Warm temperature anomalies for past three years • Copepod species diversity has been increasing since 2002. Summer of 2005 had higher biodiversity than 1997/98 El Niño event • Coho and Chinook salmon survival declining • Is any of this due to global warming? • What might the future hold?
Monthly values of PDO since 1996 However….December value = + 0.2
Next • Fish • Birds and Mammals • Nearshore
Two common “southern” species • Acartia tonsa and Paracalanus parvus • Peak abundances seen during 1983 El Niño; during 1997-98 El Niño and during 2004-2005 “warm event”. • Acartia tonsa first seen off VI in 2003 • Calanus pacificus and Corycaeus anglicus also commonly observed
SIMILAR PATTERNS AT NEARSHORE STATIONS 17.6 deg C on 19 July 04 16.7 deg C on 6 July 05; July-September climatology is 10.4º C, thus a + 6.3º C anomaly • Summer of 2004 was • also quite warm • Warming has been • going on since 2000 Last two winters have been warm as well.
Predictors • All of our predictors of salmon returns based on “ocean conditions: point to very low adult coho returns next year: • Northern Copepod Index • Spring Transition Index • Logerwell (sea level + upwelling) • Peterson (copepod community) • Salmon catches in June and September • Salmon growth
Stonewall Bank Buoy - 2005 • Once upwelling kicked in the negative SST anomalies were extreme! Although the ocean was warm until mid July in 2005, similar warming occurred in 2004 but upwelling was not as delayed.
Temperature and salinity at NH 05 at 50 m • Note abrupt shift in shelf bottom water hydrography during summers of 1998 and 2003 Fresher and warmer at depth 2003-2005, in summer Saltier in winter 04/05. Appears now to be changing to saltier in summer
Salmon catches in June surveys: 1998-2005 • Catches of coho salmon in June 2005 were lower than June 1998 during the El Niño. • True also for Chinook salmon
PDO (bars) & MEI (line) Time lag ~ 6 months, similar to species richness NH 05 Temperature Anomalies SST at NH 05 • Hydrography off central Oregon follows both the PDO and MEI. Warm (cool) waters are associated with positive (negative) values of each index.
Monthly averaged species richness anomalies at NH 05 tracks monthly averaged temperature anomalies at NH05
Bottom waters salty and cold in summer 1999-2002 then gradually freshened through 2005. • The summers were cooler for four years, 1999-2002, but began to warm in 2003; approached 1998 El Nino values in2005; now tending towards cold and salty again (since August)