Page 1
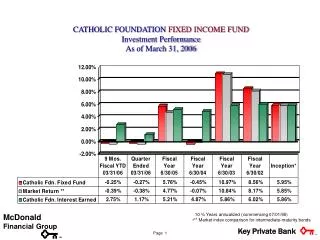
CATHOLIC FOUNDATION FIXED INCOME FUND Investment Performance As of March 31, 2006. 10 ¾ Years annualized (commencing 07/01/95) ** Market index comparison for intermediate-maturity bonds. McDonald. Financial Group. Page 1. SM. CATHOLIC FOUNDATION BALANCED FUND Investment Performance

Page 1
E N D
Presentation Transcript
CATHOLIC FOUNDATION FIXED INCOME FUND Investment Performance As of March 31, 2006 • 10 ¾ Years annualized (commencing 07/01/95) • ** Market index comparison for intermediate-maturity bonds McDonald Financial Group Page 1 SM
CATHOLIC FOUNDATION BALANCED FUND Investment Performance As of March 31, 2006 * 9 ¼ Years annualized (commencing 01/01/97) ** 50% S&P 500, 50% LBIGC McDonald Financial Group Page 2 SM
CATHOLIC FOUNDATION - EQUITY FUND Investment Performance As of March 31, 2006 • 6¼ Years annualized (commencing 01/01/00) • ** S&P 500 Stock Market Index McDonald Financial Group Page 3 SM
CATHOLIC FOUNDATION – MID CAP EQUITY FUND Investment Performance As of March 31, 2006 • 3 Years annualized (commencing 01/01/03) • ** S & P 400 Mid Cap Stock Market Index McDonald Financial Group Page 4 SM
The equity market recorded its best first quarter in a number of years. The DJIA and S&P 500 Index advanced 4.24% and 4.20%, respectively, while the technology-heavy NASDAQ Composite advanced 6.10%. Small-cap stocks performed exceptionally well during the quarter as the Russell 2000 Index returned 13.94%. The S&P MidCap 400 also performed nicely, returning 7.63%. In the large-cap universe, value stocks outperformed growth issues. In the mid- and small-cap universes, the value and growth styles performed similarly. International stocks continued to perform well as the MSCI AC World ex. U.S. Index returned 9.68% for the quarter. The market advanced in the face of higher interest rates and rising commodity prices. Returns were driven by: Continued strong domestic economic growth. Solid first quarter earnings that are expected to have grown at a low double-digit rate. The absence of meaningful wage pressures and continued low levels of core inflation. Rising merger and acquisition activity. All seven sectors recorded positive returns for the quarter. Basic Industry and Technology were the best performing sectors, followed closely by Capital Goods and Energy/Utilities. The Consumer Staples and Consumer Cyclicals sectors performed the worst. Higher interest rates pressured fixed income returns. For the quarter, the Lehman Aggregate Index recorded a return of –0.64%. Investment Highlights: March 31, 2006 Index 1st Quarter 2006 2005 DJIA 4.24% 1.72% S&P 500 4.20% 4.91% S&P MidCap 400 7.63% 12.56% S&P BARRA Value 5.42% 6.33% S&P BARRA Growth 2.92% 3.46% Russell 1000 Value 5.93% 7.05% Russell 1000 Growth 3.10% 5.26% Russell 2000 13.94% 4.55% NASDAQ w/o Div. 6.10% 1.38% MSCI AC World ex U.S. 9.68% 16.62% 3-Month T-bill (Citi) 1.03% 3.01% Lehman Aggregate -0.64% 2.43% Source: Caps 4.0. This information is based on data obtained from recognized services and sources and is believed to be reliable. Past investment performance of markets or securities mentioned herein should not be considered to be indicative of future results. Page 5
Economic Outlook: March 31, 2006 Victory’s 2006 GDP forecast -- growth to approach 4% • Robust corporate profits and spending. • Growth in government outlays. • Modest growth in consumer spending. • World economic activity accelerating expanding U.S. exports. • Energy and commodity prices remain elevated. • Housing activity and car/truck sales slow from 2005’s pace. • Benign Inflation environment; inflation expectations remain muted. • Moderate employment growth. The FOMC is focused on inflation • Federal funds rate, 5%-5.25%. • Longer term interest rates near their cyclical peak. 2006 Blue Chip consensus GDP forecast is 3.4% • Growth in first half of 2006 stronger than in second half. This information is based on data obtained from recognized services and sources and is believed to be reliable. Any opinions, projections, or recommendations in this report are subject to change without notice and are not intended as individual investment advice. Page 6
Investment fundamentals remain sound. Domestic economic growth remains strong and worldwide economic growth is accelerating. Earnings growth continues to be strong and should advance at mid- to high single-digit rates in 2006. Long-term interest rates remain low and core inflation contained. The market’s valuation appears quite reasonable with the S&P 500 Index trading at a current year price/earnings ratio of 15.6x. Increasingly, the most significant risk to the investment outlook may be the result of too rapid economic growth. The acceleration in global and domestic economic growth is putting upward pressure on interest rates. Commodity prices are rising aggressively, driving headline inflation higher and posing upside risk to core prices. Capacity utilization is at its highest level in nearly six years. We continue to expect that solid earnings growth and reasonable equity valuations will lead to high single to low double-digit returns in 2006. The following themes are currently reflected in portfolio positions: Continued strength in world-wide economic growth, particularly in rapidly developing countries, should keep upward pricing pressure on energy and industrial commodities. Capital spending should continue to be strong, favoring the Capital Goods and Technology sectors and energy services companies. A slowdown in consumer spending is possible, which could negatively impact consumer related businesses. The market’s tolerance for risk is likely to decrease, favoring larger-cap, higher quality companies. The relatively flat yield curve could pressure earnings at a number of banks and financial services companies. However, an increase in investment banking and mergers and acquisitions could offset some of this pressure. Mergers and acquisitions may also provide support for the broad equity market given large corporate cash balances and the significant amount of capital raised by private equity investors. Equity Outlook: March 31, 2006 This information is based on data obtained from recognized services and sources and is believed to be reliable. Any opinions, projections, or recommendations in this report are subject to change without notice and are not intended as individual investment advice. Page 7
Fixed Income Review & Outlook: March 31, 2006 • The Federal Reserve maintained its policy of removing what it believes is an accommodative monetary policy. Today, the Fed Funds rate sits at 4.75%, a result of 15 consecutive 25 basis point increases. We believe the Fed has found its desired neutral monetary policy and is nearing the end of the tightening cycle. As the chart at the bottom illustrates, the entire curve felt the brunt of the Fed activity during Q1/06. The yield curve should remain flat and the fixed income market should be relatively stable for the remainder of the year. • Credit as an asset class outperformed treasuries as rumored pension reform continued to fuel long end demand. Industrials and utilities posted the strongest excess returns while emerging markets concerns dampened non-corporate credit results. We continue to favor issues with protective covenants in order to mitigate leveraged buy out (LBO) risk. • Securitized bonds (MBS, ABS and CMBS) outperformed treasuries after a difficult 4th quarter. Investor demand returned in recognition of generally solid real estate and consumer fundamentals. Despite richer valuations, CMBS continue to have value. Bonds that feature consumers who lack the financial flexibility to weather higher rates (e.g. sub-prime MBS) should be avoided. • Overall the fixed income markets appear fairly valued; as such, security selection will drive the performance of fixed income portfolios. U.S. Treasury Yield Curve Source: Bloomberg. This information is based on data obtained from recognized services and sources and is believed to be reliable. Any opinions, projections, or recommendations in this report are subject to change without notice and are not intended as individual investment advice. Past investment performance of markets or securities mentioned herein should not be considered to be indicative of future results. Page 8
CATHOLIC FOUNDATION OF THE DIOCESE OF TOLEDOINVESTMENT STYLE • Catholic Foundation Fixed Income Fund • When interest rates rise, the price (market value) of the fixed income fund falls and total return is lower than income return (1999, 2004). • When interest rates fall, the price (market value) of the fixed income fund rises and total return is higher than income return (1998, 2001, 2002, 2003 & 2005). • We usually hold bonds to maturity, and price fluctuations tend to even out over time. Thus, the primary goal of this fund is to earn interest income. For budget planning, earnings should approximate 4.50% to 4.75% for the current June, 2006 fiscal year. • Catholic Foundation Balanced Fund • The Balanced Fund provides diversification by including both stocks and bonds in a 50/50 mix. • Year-to-date returns will depend on how both the stock market and the bond market perform. While total returns are not predictable year-to-year, income from interest and dividends this year should approximate 2.50% for budget planning. • Total return on this fund has averaged over 6% per year since 1/1/97, despite recent stock market declines. A 50/50 stock/bond mix has averaged 7% to 8% historically. Page 9
CATHOLIC FOUNDATION OF THE DIOCESE OF TOLEDOINVESTMENT STYLE • Catholic Foundation Equity Fund • Investment return depends on performance of the stock market, specifically, the Standard & Poors 500 Index. • Although the Catholic Foundation initially offered the fund to participants on 1/1/2000, the Victory Stock Index Fund has averaged over 7% total return for the past 9 years through 6/30/05 despite recent stock market declines. • Future returns are not predictable on the stock market, but will likely be lower than the long-term 9-10% historical average. • Dividend income from this fund is likely to average 0.75% to 1.00% this year. • Catholic Foundation Mid Cap Equity Fund • Investment return depends on performance of the stock market, specifically, the MSCI 450 Mid Cap Index. • Allows diversification vs. the Large-Cap Standard & Poors 500 by covering mid-sized companies. • Dividend Income from this fund is minimal. • Catholic Foundation Money Market Fund • Investment return depends on short-term interest rates. • Objective is to provide stability of principal and liquidity. • Interest income should approximate 3% for the current fiscal year. Page 10