Download
1 / 108
1.09k likes | 1.31k Vues
Due To Deregulation, Liberalization and Globaliza-tion The Traditional Bank Business Has Changed Dramatically. Banks can enter a business that had been off limits before Deepening of Capital markets connected corporates directly to the market.

E N D
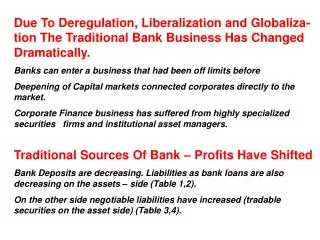
Due To Deregulation, Liberalization and Globaliza-tion The Traditional Bank Business Has Changed Dramatically. Banks can enter a business that had been off limits before Deepening of Capital markets connected corporates directly to the market. Corporate Finance business has suffered from highly specialized securities firms and institutional asset managers. Traditional Sources Of Bank – Profits Have Shifted Bank Deposits are decreasing. Liabilities as bank loans are also decreasing on the assets – side (Table 1,2). On the other side negotiable liabilities have increased (tradable securities on the asset side) (Table 3,4).
In Most G7-Countries Bank Deposits in Percent of Total Liabilities were Decreasing During the Last Twenty Years Table 1. Bank Deposits in percent of total bank liabilities
In Some G7-Countries also Bank Loans as in Percent of Total Bank Assets Decreased Table 2. Bank Loans in percent of total Bank Assets
Banks are Using More and More Capital Market Instruments to Refinance Their Businesses Table 3. Negotiable Liabilities in percent of total Bank Liabilities
Banks Have Also Entered resp. Enlarged Their Asset Management Businesses Table 4. Tradable Securities Holding in percent of Total Bank Assets
Three Major Changes In The Composition Of Bank‘s Balance SheetsDisplacement of lending by other activities.Growth of off-balance-sheet assets in percent of total assets.Displacement of deposit loan-income by other operating income. Changes Are Reflected By Desegementation And RestructuringExpanding into other markets (Securities) to face competition to the Asset Management Industry.Entering the insurance marketsEntering Asset Management business providing investment management services and a wider range of financial services to their customers.All this changes are reflected by heavily increasing M & A – activities.
Source of Bank Profits Have Shifted From Interest Related Income to Other Income Table 5. Balance Sheet Information of Top 50 Banks in percent as noted
The Traditional View of Financial Intermediation Has Eroded • Traditionally banks intermediate between borrowers and savers by using deposits, securities firms were providing the distribution of new issues of equity and debt to public. • On the supply side, Nonbank financial institutions have entered the traditional bank business. Insurance Comp., Investment banks, even telcos and food companies are providing bank-services. • On the demand side, households were bypassing banks by investing directly to those investment firms which could – cause of theire specializtion – more effective handle the savings. • As a result from this, the nonbank-sector became larger and larger.(Table 6,7). In the United States the nonbank-sector is managing (1995)11,5 trillion US$ compared to 5 Trillion $ in the banking sector.
Institutional Investors Were Steadily Growing at High Average Rates Table 6. Assets of Institutional Investors
Institutional Investors Were Steadily Growing at High Average Rates Table 7. Assets of all Institutional Investors in % of GDP
Globalization • Financial Markets Are Facing Closer Integration • Liberalization and Development of Information Technologies prepared the way to globalization and integration • Securities Portfolios became far more internationally diversified (Table 8). The growth in gross portfolio flows increased by almost more than 200 times. • Cross border transactions in Bonds and Equities reached up to between seven and one times GDP. In the US those transactions between US and foreign investors totaled 17 Trillion US$. (see Table 9) or 213% of the US - GDP. • Although investment portfolios are fare away from beeing adequately internationally diversified, i.e. portfolios still do not reflect the the structure of the world market capitalization (USA: 42%, Japan 15%, UK: 9%, other industrial countries: 23%, emerging markets: 11%)
Globalization Financial Markets are Facing Closer Integration • Mirroring this expansion firms also turned to international markets to raise funds (see Table 10). • Even the volume of outstanding issues of international debt securities reached to 3,7 Trillion US $, sixfold larger than in 1985. • Financial Globalization has been a counterpart to international trade. The foreign exchange market has far outpaced the growth of trade. In 1995 an annual worldwide trade volume of 6,1 Trillion US$ was faced by a daily market turnover of 1,2 Trillion US $. (see T.11.) • Nonresidents holdings of public debt also increased substantially (see Table 12)
Foreign Net and Portfolio Investments (in bn $) Table 8. Gross and Net Flows of Foreign Direct and Portfolio Investment (G7)
Cross Border Transactions of Bonds and Equities Table 9. Cross Border Transactions in Bonds and Equities
Foreign Exchange Trading (Turnover in bn $ per day) Table 11. Foreign Exchange Trading
Nonresidents Holdings of Public Debt (in % of Total Debt) Table 12. Nonresidents‘ Holdings of Public Debt(in percent of total public debt)
Accompanying all this, we can observe extending linkages between international Exchanges (Eurex, CBOT and Eurex) • OTC- and Exchange traded markets will merge • New Markets for unbundling and trade of risks will emerge • Actually the risk market volume is estimated to reach up to a volume of more than 130 Bio US$ /year (notional amount outstanding per end of year). This would be more than the total volume of all traded bonds, equities and bank assets Outlook to new market propositions • In future we will face an ongoing increase of methods and products concerning risk markets, also dealing new kinds of risks like: • Catastrophe Risks (ART) – will change insurance marketsCredit Risks – will change the business potential of credit business.Private Income Risks
New Trends New Markets New Chances New Risks
Risk Exposure of U.S. bank: Foreign Exchange Risk Interest Rate RiskCredit Risk Risk Management Tools: Currency Swap (Y/US$) Interest Rate Swap (V/F)Credit Default Swap New Markets and Products for Unbundling, Pricing, Trading and Managing Risks Example: U.S. bank has given a floating – rate Yen denominated loan to a Japanese bank. Credit-risk loaded floating-rate, Yen-denominated loan Riskless, fixed rate dollar denominated security
How Risk – Management Works Japanese Bank US Bank 100 Bio Y at LIBOR Floating – Rate YenLoan Floating – Rate YenCredit LIBOR Payed in Y Payback in Yen LIBOR in Yen InterestRateSwap Fixed rate in Yen Fixed Rate Dollar Loan Yen - Payer OTC - Market CurrencySwap US$ Receiver Credit Default Swap
Growth in Global Security Issues,1990-2003 $ Bn Global debt & equity U.S. Issuers worldwide
Derivatives - Notional Amount Outstanding per 12/1987 to 12/2005
MarketsareInterlinked Example:Spot and Futures Market
Long Future = Buyer Profit Index 5,500 Short Future = Seller Loss Spot – Future - Parity Spot – Future – ParityIndex Arbitrage (Example) Today, one (theoretical) Index-Future is sold at 5,500 € (1€ per Index-point). Long and Short-positions can be described by a profit and loss diagram: If you are Long-Future, then you may claim for delivery of „one index“ at a price of 5,500 € at the maturity of the index-future. That means, if the index at delivery is quoted at more than 5,500, you will win from your futures position.
Spot – Future - Parity Spot – Future – ParityIndex Arbitrage (Example) You hold an Index-Portfolio, currently valued at 5,500 € (1 Index-point = 1 €). If the annual risk free rate rf is at 3.5 % and the expected dividends on your Index portfolio are at 100 € (d = 100/5,500) , an Index – Future with one year to maturity has a fair price of: To prevent our Index-Portfolio from losses, we could hedge the price risk by taking a short – future position (selling a future at 5,592.40).
Profit Short Future Index 5592,40 Loss Spot – Future - Parity Spot – Future – ParityIndex Arbitrage (Example) The total expected payoffs from your portfolio will depend on the fu-ture state of the environment (see below payoffs 1-5). A decreasing stock market will be compensated by profits from the short future po-sition, increasing stock prices will be outbalanced by losses due to pay-ment obligations from the future.
Spot – Future - Parity Spot – Future – ParityIndex Arbitrage (Example) Initially you have paid 5,500 € for your stock portfolio. Taking the short future position, the final outcome of your portfolio will be 5,692,40 €, whatever the stock price will be, i.e. you will earn 192,40 which equals 3.5%. Obviously, this profit is riskless: Spot-Future- Parity
Spot – Future - Parity Spot – Future – ParityIndex Arbitrage (Example) Rising future prices will – due to arbitrage trading - induce rising spot prices. For example, a future traded at 6,000 € is (relative to a spot market price of 5,500) clearly overpriced, if the stock price remains unchanged at 5,500 €. In this case, „smart“ traders will make arbitrage profits of 407,50 € per contract and bring back the market to equilibrium: Note, that the arbitrage profit equals the difference between a fair- and mispriced future (6,000 – 5,592,40) plus Dividends. Higher Future prices will lead to massivly increased demand at spot markets until spot prices and futures are back to equilibrium.
Spot – Future – ParityFinancial Market Stability Spot – Future – ParityIndex Arbitrage (Example) • Spot Markets and Future (Forward) Markets are interlinked. • Mispriced spot or future market instruments will affect both markets. • Future market speculations that drive futures prices will also drive spot market prices due to arbitrage trading (et vice versa). • Speculation on futures markets, resulting in higher future prices will induce higher spot market prices due to arbitrage trading. Finally this may result in spot market bubbles that jeopardizes the allocation mechanism of real goods markets.
Management of Operational Risks: Weather Derivatives
Weather – DerivativesHistory • Weather – Derivatives occured in 1997 in the USA after the El Niño effects. (Aquila Energy, Kansas City/Missouri). • At the end of 1998 first Weather – Derivatives were issued in Germany • Since 1998 Weather – Futures and Weather - Options are traded at the Chicago Mercantile Exchange . • In August 2001 London International Financial Futures Exchange (LIFFE) started trading Weather Futures. • Eurex planned to launch weather related derivatives in 2004.
Weather – Derivatives German Temperature Index Xelsius
Weather – Derivatives German Temperature Index Xelsius
Weather – Derivatives German Temperature Index Xelsius HDDInterval = Max { 0, 18°C - Temp } CDDInterval = Max { 0, Temp - 18°C } Example: On December, 12th 2001 the average temperature in Berlin has been - 6° C. This day the Index shows 24 HDD.
Weather – Derivatives In many cases operational income is directly weather related
Weather – Derivatives In many cases operational income is directly weather related The annual turnover (Business Unit Heating Energy) of the former Berlin Energy - Supplier BEWAG (now VATTEN-FALL) 1999 / 2000 mounted to 771 Mio DM. The winter season 1999/2000 showed 2.425 HDD. This equals an average turnover per HDD of 320 TDM. If the winter would have been warmer (for example at only 2000 HDD) this would have caused a lower turnover of approx. 425 HDD x 320 TDM = 136 Mio DM.Insofar BEWAG‘s operational income is directly related to the average temperature in winter season.
Weather – DerivativesThe Payoff-Profile from Heating Business remembers to the payoff profile of a financial future. Example: If 2500 HDD would represent an average cold winter, then a higher number of HDD would create additional turnovers, whereas a lower number would lead to a smaller turnover.
Weather – DerivativesIn this example the risk of warmer winters (i.e. < 2500 HDD) could be hedged by weather futures. At a Standard of 100 € per HDD, a weather future on the basis of 2500 HDD has a contract value of 2500 x 100 € = 250 T€. Given a profit-margin of approx. 20% (turnover at 2500 HDD = 2500 x 320 TDM = 800 Mio DM (400 Mio €) i.e. a total average profit of 160 Mio DM or 80 Mio € resp. an average profit per HDD of 32 T€) BEWAG could hedge the weather risk selling 320 weather – futures at an Index of 2500 HDD.
2300 368 74 6,4 80 2400 384 77 3,2 80 2500 400 80 0 80 2600 416 83 - 3,2 80 2700 432 86 - 6,4 80 Weather – DerivativesIf BEWAG takes the short-position this could result in the following scenarios: Income from Operational Income Short Future HDD Turnover Profit Total Profit (Mio €) (Mio €) (Mio €) (Mio €) 2000 320 64 16 80 2100 336 67 12,8 80 2200 352 70 9,6 80 2800 448 90 - 9,6 80 2900 464 93 - 12,8 80 3000 480 96 - 16 80
Weather – Derivatives Payoff-profiles of a hedged (operational) business are similiar to the payoff-profiles of a future hedged trade.
Short Put ata Strike of 2500 HDD Cap at 2300 HDD 2500 HDD Long Put at a Strikeof 2500 HDD Weather – Derivatives OptionsPut - Options Hedging with weather futures means not only to eliminate operational risks but also to eliminate the chance of having a better result than hedged. To avoid this, one could lmake use of weather options (as traded at LIFFE). To minimize option premiums, options frequentlly contain caps or floors.
Weather – Derivatives Options Call - Options To buy a put at a strike of 2500 HDD leads to compensations when the average number of HDD is below 2500 HDD. To buy a call wouold mean, that the buyer can claim fo compensation-payments if the number of HDD is above 2.500 HDD. Short Call at a Strike of2500 HDD 2500 HDD Long Call at a Strikeof 2500 HDD Floor at 2700 HDD
Weather CollarShort Call 2700 HDD and Long Put at 2300 HDD Max. Chance Max. Risk
Weather Collar(Short Call 2700 HDD and Long Put at 2300 HDD) A Zero – Cost Weather – Collar (Short Collar) can be designed to restrict the volatility of weather related profits wo to the boundaries of an upper and lower limit.
Management of Operational Risks: Non Performing LoansandCredit Risk Marktes
Topics Covered: • NPLs in China and Germany • Origin and Dynamics of NPLs • Centralized Problem Solving Approaches • Decentralized Problem Solving Approaches • Outlook
300 Mrd. Germany: At a Total Volume of 3,500 bn. € Loans Outstanding approx. 300 bn. € are Non Performing (estimated in 2004)
Referring to Fundamental Data (Profits) German Stock Markets Were Overvalued From 1997-2001
Although Investments (Plant, Machinery) Were Decreasing Loans to Enterprises Remained High