Download
1 / 19
190 likes | 284 Vues
ECODRIVE Ecosystem Change in the North Sea: Processes, Drivers, Future Scenarios 2009 – 2012. Overarching Theme Impact of Climate. NAO+. NAO-. NAO-Index. http://www.ldeo.columbia.edu/res/pi/NAO/. NAO winter index. North Sea. Baltic Sea.

E N D
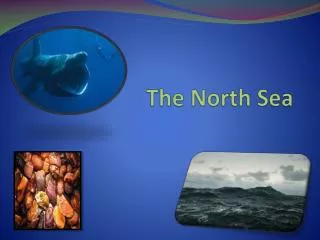
ECODRIVE Ecosystem Change in the North Sea: Processes, Drivers, Future Scenarios 2009 – 2012 Overarching Theme Impact of Climate
NAO+ NAO- NAO-Index http://www.ldeo.columbia.edu/res/pi/NAO/
NAO winter index North Sea Baltic Sea NAO winter index, annnual temperature minimum in the Intermediate Winter Water (IWW) of the Bornholm Basin, Station K2, (solid line) and annual SST anomalies at Helgoland Roads (dashed line) Alheit et al. 2005
North Sea Central North Sea, anomalies: SST, phytoplankton colour, dinoflagellates, diatoms Edwards and Johns 2006
Regime Shift Nordsee Edwards et al., SAHFOS Techn. Rep. (in press) CPR data
Surface air temperature anomalies (Johannessen et al. 2004) AMO – Atlantic Multidecadal Oscillation Kerr, Science, 2005
Relative SST anomalies, plotted as five-year averages from 1910 to 2005. ICES Zooplankton Status Report 2006/07 (O’Brien et al. 2008)
Decadal changes in distributions of Northeast Atlantic calanoid copepods, based on rate of occurrence in CPR samples. Beaugrand (2005).
Anchovy catch rates courtesy D. Reid 1990 1995 2004
Fischereiwelt (1950) Helgoländer Meeresunters. 4 (1953)
Spawning stock biomass (SSB) of Norwegian spring-spawning herring and the longterm-averaged temperature (the AMO signal) (Toresen og Østvedt 2000) Long-term averaged temperature Stock collapse caused by overfishing under a cooling climate Start of the new herring period after 17 years of fishing moratorium and the formation of the outstanding 1983 year class
What is impact of interactions of NAO, AMO and Global Warming on marine ecosystems? Four winter climate regimes in SLP (Hurrell and Deser, in press) AMO (Atlantic Multidecadal Oscillation) (Kerr, Science 2005)
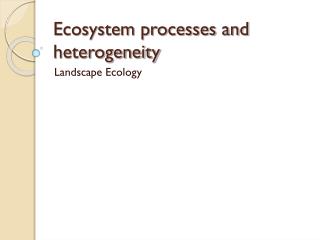
ECODRIVE Focus on Climate ► Impact of climate variability ● North Atlantic Oscillation (NAO) ● Atlantic Multidecadal Oscillation (AMO) ► Impact of Global Warming Methods ► Field sampling ► Retrospective time series analysis ● Continuous Plankton Recorder ● Helgoland Roads Series ► Modeling
Hering Clupea harengus Sprotte Sprattus sprattus Sardine Sardina pilchardus Sardelle (Anchovis) Engraulis enchrasicolus
In this conceptual diagram, EVERYTHING is inter-related. The colors denote interactions. Approach discussed at IHF. Mike sees „stoplight“ approach – as an important visualization of ecosystem state (past, present & future). The approach shown can be used for „everything, or all ecosystem components“ or just selected key species... The latter might be better, but selling both is likely worthwhile. WP1 compiles information on field data and basic species-specific interactions (trophic coupling between key species) and includes basic ecophysiology (abiotic controls on species groups, etc). Basically, this is a WP where we assemble what is known. Additional cruises (proposed field data collection) can be added here. Knowledge from WP1 is then combined with modelling efforts in WP2 that produce time series (red + blue = purple). WP2 delivers time series (e.g., stratification, temperature, turbulence – physical factors that influence biology). The informed proxies come out of this retrospective analysis (WP1 & Wp2) along with model improvement (NPZD groups better defined based upon work from WP1. Yellow chosen here as the third primary color. The combination of yellow & blue = green (future scenarios). Drivers like eutrophication and exploitation levels/patterns should be included. Regional downscaling based on IPCC scenarios can be used to run hydrodynamics models... That drive future change based upon work in WP4. The big circle is project intergration WP (6).... System Description (WP1) Time Series (field data) Trophic Coupling (biotic) Ecophysiology (abiotic) (WP6) project integration (WP3) Past / Present Responses (WP4) Informed Proxies (WP5) Future Senarios MSVPA ( Tertiary Exchange ) NPZD ( phyto- Zoopl ) Hydro- Climate (physics) System Modelling (WP2)
Egg and larvae distribution of anchovies and sardines in German Bight 1951 2003
Regime Shift Baltic Sea DiatomsDinoflagellates Wasmund and Uhlig 2003 Changes on 3 trophic levels: - phytoplankton - zooplankton - fish Alheit et al. 2005