25N
25N. Angat/ Manila. Iloilo. Cebu. Philippines Pilot Project Areas. JJA. Climatology. NCEP-NCAR Reanalysis 925 hPa wind UEA Precipitation. OND. Composite PRCP (UEA) and Reanalysis V’ 850 for 10 El Ni ñ o Events (1950-1998). JJA. OND. Reanalysis V’ 850 and UEA PRCP’

25N
E N D
Presentation Transcript
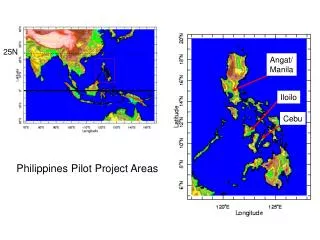
25N Angat/ Manila Iloilo Cebu Philippines Pilot Project Areas
JJA Climatology • NCEP-NCAR Reanalysis 925 hPa wind • UEA Precipitation OND
Composite PRCP (UEA) and Reanalysis V’850 for 10 El Niño Events (1950-1998) JJA OND
Reanalysis V’850 and UEA PRCP’ Individual El Niño Events JJA 1972 OND 1965
Composite PRCP (UEA) and Reanalysis V’850 for 10 La Niña Events (1950-1998) JJA OND
S. Luzon (Clark AB) Daily PRCP > 1mm (1953-1991) ENSO signal reverses between JJA and OND... OND cumulative probability red = El Nino black = La Nina ( Kolmogorov-Smirnov test ) p < 0.05 mm/day JJA cumulative probability red = El Nino black = La Nina p < 0.01 mm/day
(OND) Statistical Predictors: “Local”, and Nino 3.4 SST Anomalies p1 p2 Plot: Correlation between anomalies of Philippines rainfall (UEA average) and SST Predictors: Time series (OND) of area-averaged SST anomalies in above regions
Using CCA to Study Potential Predictability • Investigate Seasonal Predictability Through the Annual Cycle • NCEP-NCAR Reanalysis V850 • ECHAM 4.5 V850 Simulations • PRCP Analyses from UEA 1950-1998 (0.5 deg. lat/long grid) • Relate Statistical Predictors to Modes of Large-Scale Variability
(OND) Reanalysis u’8501st EOF Structure (33% var.) Time Series (1960 – 1998)
(OND) Reanalysis u’850 1st 3 EOFs and UEA PRCP canonical correlation = 0.80
(OND) 2 SST Predictors (“Local” and Nino 3.4 SST’) canonical correlation = 0.75 p2 p1
(OND) Reanalysis v’850 1st EOF Structure (21% var.) Time Series (1960 – 1998)
(OND) ECHAM 4.5 1st 2 EOFS [u’, v’]850 & UEA PRCP’ canonical correlation = 0.63
(OND) Correlation 1st EOFReanalysis u’, v’ & SST’ 1st EOF u’ 850 1st EOF v’ 850
(OND) ECHAM 4.5 Correlation 1st EOF [u’, v’]850 & SST’ 1st EOF u’ 850 1st EOF v’ 850