Download
1 / 1
20 likes | 199 Vues
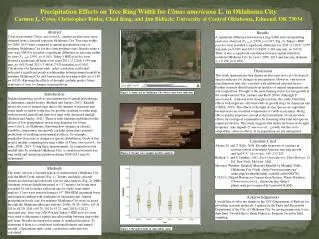
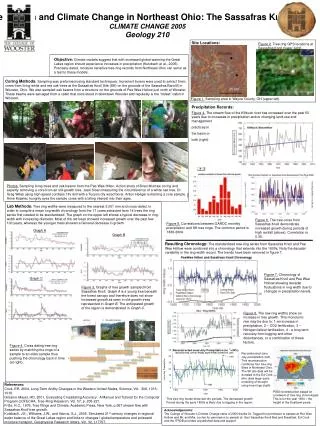
Precipitation Changes in Northeast Ohio Inferred from Tree Ring Widths, Kline Farm, Holmes County, Ohio The College of Wooster, Geology Climate Change Class 2006. Methods. Results. Background.

E N D
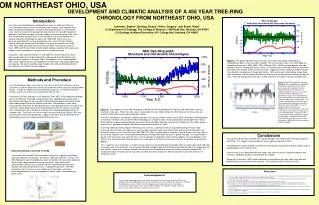
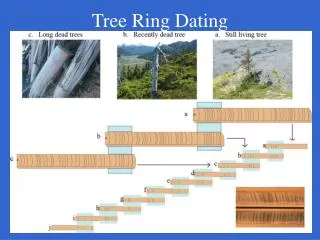
Precipitation Changes in Northeast Ohio Inferred from Tree Ring Widths, Kline Farm, Holmes County, Ohio The College of Wooster, Geology Climate Change Class 2006 Methods Results Background The strongest climatic relationship between tends to occur in June based on increase in tree growth. The cause of the exhibited increase in tree growth is undetermined at present, but hypotheses that are currently being tested include increased precipitation, increased carbon dioxide fertilization and nitrogen fertilization. Mean monthly temperature and precipitation of Wooster, Ohio has been recorded continuously since 1888 by the Ohio Agricultural Research and Development Center (OARDC). These data are presented here to characterize the climate of the region and to compare with the tree-ring records generated from the white oak stand at Kline Farm. At Organic Valley Farm, samples were obtained by extracting three cylindrical cores from nine different trees. For each tree a GPS Location was taken and the circumference (Fig. 8) of the tree was measured. Figure 10. Standard deviation and average monthly precipitation values. Note the highest variability occurs in summer. Figure 11. Standard deviation and average monthly temperatures and shows variation around the mean (red line). Figure 1. Mean monthly temperature since 1888. As expected, summer months have the highest values with a maximum for June. Figures 4-7. Climate Change class and David Kline coring and measuring white oaks at the Kline Family Farm Upon returning to the College of Wooster, cores were prepared and mark for dendroclimatic analysis. Ring widths were measured to the nearest 0.001 mm. Crossdating was done with the aid of the computer program COFECHA (Fig. 9). The Kline Farm cores were compared with a regional master tree-ring series from Northeast Ohio to check the . Figure 12. June Mean Monthly Temperature has the highest correlation to the KF Standardized Index, with summer correlations in general being higher than other seasonal correlations of temperature. The clear correlation between the two curves, numerically calculated as -0.39, indicates the plausibility of causality between temperature and ring growth. Figure 13. The decrease in the monotonic rise after standardization of the raw data is apparent in their juxtaposition. The removal of this trend, which may be due to anthropogenic addition of nutrients into the climate system and terrain changes, should accentuate trends indicating a variation in climatatic factors. Figure 2. Mean monthly precipitation since 1888. Summer months have the highest average precipitation values. Note that the is a summer maximum and a secondary maximum in January. The Kline Farm is an Amish farm owned and operated by David Kline. It is located in Holmes County, Ohio and has old growth white oak (Quercus alba) trees. The 2006 Climate Change class from the College of Wooster collected a number of tree core samples of white oak from this area to study the ages of these trees. Nine trees were cored for this project. Figure 8. Graph showing age of tree compared with the tree circumference . Note that there is not a clear relationship between tree age and tree size. Figure 14. The month of June also proves important in regards to its precipitation. Here, June precipitation is graphed with the KF Standardized Index. There is a clear correlation between the two curves, numerically calculated as 0.35, indicating the plausibility of causality between the precipitation and ring growth. Figure 15. An increase in ring widths in Northeast Ohio over the past 400 years, based on trees which began their growth prior to 1800. The red line shows variation in sample size, which peaks around the year 1800 because that is the age of most historical structures dated (for nonliving trees). The blue line shows high frequency, annual variability in ring widths, and the green line shows the low frequency trends in width size. Acknowledgements: We would like to thank David Kline for allowing us to obtain samples from his farm.The OARDC meteorological data was obtained from the Global Historical Climate Network (GHCN). Also, thanks to Nigel Brush for arranging our trip to the Kline Farm. Ed Cook (Lamont-Doherty Earth Observatory) provided advice regarding tree-ring processing. Figure 9. Principle of Crossdating. To extend a tree-ring chronology, tree rings of living trees can be compared to samples of recently dead trees, which can e compared to long-dead trees. Figure 3. Topographic map of Holmes County. Red dot indicates location of Kline Farm.