Digital Signal Processing: Sampling, Reconstruction, and Models
Understand discrete-time signals, Z-transforms, anti-aliasing filters, and more in digital signal processing. Learn about aliasing effects, signal reconstruction, discrete transfer functions, and system stability in digital systems.

Digital Signal Processing: Sampling, Reconstruction, and Models
E N D
Presentation Transcript
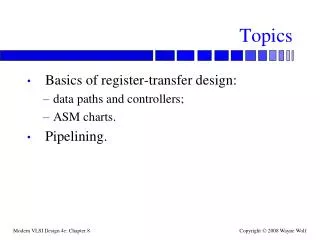
Topics Specific topics to be covered are: • Discrete-time signals • Z-transforms • Sampling and reconstruction • Aliasing and anti-aliasing filters • Sampled-data control systems
Sampling The result of sampling a continuous time signal is shown below: Figure 1:The result of sampling
Example 1 Consider the signal We observe that if the sampling period is chosen equal to 0.1[s] then from where it is evident that the high frequency component has been shifted to a constant, i.e. the high frequency component appears as a signal of low frequency (here zero). This phenomenon is known as aliasing.
Conclusion: To mitigate the effect of aliasing the sampling rate must be high relative to the rate of change of the signals of interest. A typical rule of thumb is to require that the sampling rate be 5 to 20 times the bandwidth of the signals.
Signal Reconstruction The output of a digital controller is another sequence of numbers {u[k]} which are the sample values of the intended control signal. These sample values need to be converted back to continuous time functions before they can be applied to the plant. Usually, this is done by interpolating them into a staircase function u(t) as illustrated in Figure 3.
Illustration of Signal Reconstruction Figure 4:The result of reconstruction
Modelling Given the process of signal reconstruction and sampling, we see that the net result is that, inside the computer, the system input and output simply appear as sequences of numbers. It therefore makes sense to build digital models that relate a discrete time input sequence, {u(k)}, to a sampled output sequence {y(k)}.
Linear Discrete Time Models A useful discrete time model of the type referred to above is the linear version of the high order difference equation model. In the discrete case, this model takes the form:
The Shift Operator Forward shift operator In terms of this operator, the model given earlier becomes: For a discrete time system it is also possible to have discrete state space models. In the shift domain these models take the form:
Z-Transform Analogously to the use of Laplace Transforms for continuous time signals, we introduce the Z-transform for discrete time signals. Consider a sequence {y[k]; k = 0, 1, 2, …]. Then the Z-transform pair associated with {y[k]} is given by
A table of Z-transforms of typical sequences is given in Table 2.1 (see the next slide). Also, a table of Z-transform properties is given in Table 2.2 (see the slide after next).
Table 2.2:Z-transform properties. Note that Fi(z) = Z[fi[k]], [k] denotes, as usual, a unit step, y[] must be well defined and the convolution property holds provided that f1[k] = f2[k] = 0 for all k < 0.
How do we use Z-transforms ? We saw earlier that Laplace Transforms have a remarkable property that they convert differential equations into algebraic equations. Z-transforms have a similar property for discrete time models, namely they convert difference equations (expressed in terms of the shift operator q) into algebraic equations. We illustrate this below for a discrete high-order difference equation model:
Discrete Transfer Functions Taking Z-transforms on each side of the high order difference equation model leads to where Yq(z), Uq(z) are the Z-transform of the sequences {y[k]} and {u[k]} respectively, and
We then see that (ignoring the initial conditions) the Z-transform of the output Y(z) is related to the Z-transform of the input by Y(z) = Gq(z)U(z) where Gq(z) is called the discrete (shift form) transfer function.
An interesting observation We see from Table 12.1 that the Z-transform of a unit pulse is 1. Also, we have just seen that Z-transform of the output of discrete linear systems satisfies Y(z) = Gq(z)U(z) where Gq(z) is the transfer function and U(z) the input. Hence, the transfer function is the Z-transform of the output when the input is a Kronecker delta.
Example: Find the unit step response of a system with transfer function given by Solution: The Z-transform of the step response, y[k], is given by The response is shown on the next slide.
Figure 5:Unit step response of a system exhibiting ringing response
Note that the response contains the term (-0.5)k, which corresponds to an oscillatory behavior (known as ringing). In discrete time this can occur (as in this example) for a single negative real pole whereas, in continuous time, a pair of complex conjugate poles are necessary to produce this effect.
Discrete System Stability Relationship to Poles We have seen that the response of a discrete system (in the shift operator) to an input U(z) has the form where 1 … n are the poles of the system. We then know, via a partial fraction expansion, that Y(z) can be written as
where, for simplicity, we have assumed non repeated poles. The corresponding time response is Stability requires that [j]k 0, which is the case if [j] < 1. Hence stability requires the poles to have magnitude less than 1, i.e. to lie inside a unit circle centered at the origin.
Discrete Models for Sampled Continuous Systems So far in this chapter, we have assumed that the model is already given in discrete form. However, often discrete models arise by sampling the output of a continuous time system. We thus next examine how to obtain discrete time models which link the sampled output of a continuous time system to a sampled input. We are thus interested in modelling a continuous system operating under computer control.
Details of how the plant input is reconstructed When a zero order hold is used to reconstruct u(t), then Note that this is the staircase signal shown earlier in Figure 2. Discrete time models typically relate the sampled signal y[k] to the sampled input u[k]. Also a digital controller usually evaluates u[k] based on y[j] and r[j], where {r(k)} is the reference sequence and j k.
Using Continuous Transfer Function Models We observe that the generation of the staircase signal u(t), from the sequence {u(k)} can be modeled as in Figure 7. Figure 7:Zero order hold
Figure 7: Discrete time equivalent model with zero order hold Combining the circuit on the previous slide with the plant transfer function G0(s), yields the equivalent connection between input sequence, u(k), and sampled output y(k) as shown below:
We saw earlier that the transfer function of a discrete time system, in Z-transform form is the Z-transform of the output (the sequence {y[k]}) when the input, u[k], is a Kronecker delta, with zero initial conditions. We also have, from the previous slide, that if u[k] = K[k], then the input to the continuous plant is a Dirac Delta, i.e. us(t) = (t). If we denote by Heq(z) the transfer function from Uq(z) to Yq(z), we then have the following result.
Example 3 Consider the d.c. servo motor problem used as motivation for this chapter. The continuous time transfer function is Using the result on the previous slide we see that
This model is of the form: Note that this is a second order transfer function with a first order numerator. The reader may care to check that this is consistent with the input-output model which was stated without proof in the introduction i.e. We have thus fulfilled one promise of showing where this model comes from.
Using Continuous State Space Models Next we show how a discrete model can be developed when the plant is described by a continuous time state space model Then, using the solution formula (see Chapter 3) the sampled state response over an interval is given by Now using the fact that u(+k) is equal to u(k) for 0 < we have
where Also the output is
Shift form The discrete time state space model derived above can be expressed compactly using the forward shift operator, q, as where
Frequency Response of Sampled Data Systems We next evaluate the frequency response of a linear discrete time system having transfer function Hq(z). Consider a sine wave input given by where Following the same procedure as in the continuous time case (see Section 4.9) we see that the system output response to the input is where
The frequency response of a discrete time system depends upon ej and is thus periodic in with period 2/. The next slide illustrates this fact by showing the frequency response of
Figure 8:Periodicity in the frequency response of sampled data systems.
Another feature of particular interest is that the sampled data frequency response converges to its continuous counterpart as 0 and hence much insight can be obtained by simply looking at the continuous version. This is exemplified below. Example 4: Consider the two systems shown in Figure 8 on the next page: Compare the frequency response of both systems in the range [0, s].
The continuous time transfer function The continuous and discrete frequency responses are:
Note that for << s and a << s i.e. << 1 and a << 1, then we can use a first order Taylor’s series approximation for the exponentials e-a and ej in the discrete case leading to The next slide compares the two frequency responses as a function of input frequency for two different values of . Note that for small, the two frequency responses are very close.
Figure 8: Asymptotic behavior of a sampled data transfer function