Counterterror Intelligence Visualization Strategies
This document presents a comprehensive review of information visualization needs for counterterrorism intelligence, focusing on capabilities, technologies, and requirements. Syndicate 4 members worked on methods to fuse and visualize massive military data, addressing the challenges of presenting non-physical information effectively. The model emphasizes the importance of gathering, analyzing, and presenting intelligence data through advanced visualization technologies.

Counterterror Intelligence Visualization Strategies
E N D
Presentation Transcript
Information Visualizationfor CounterTerror IntelligenceDavid ZeltzerFraunhofer Center for Research in Computer Graphics, Inc.Providence RIInformation Visualization Needs for Intelligence and CounterTerrorN/X Meeting10-11March, 2003 Penn State University
Syndicate 4: Information Visualization • Massive Military Data Fusion and Visualisation: Users Talk with Developers • Workshop IST-036/RWS-005 • 10-13 September 2002 • Halden NORWAY • Syndicate 4 Members • Denis Gouin • Zack Jacobson • “Kesh” Kesavadas • Hans-Joachim Kolb • Vincent Taylor • Johan Carsten Thiis • David Zeltzer
Overview • Syndicate 4 Approach • Visualization Reference Model • Counter Terror Intel Requirements • Capabilities and Technologies
Halden Syndicate 4 Approach • Information Visualization • How to present “non-physical” information with no straightforward mapping to 3D metaphor? • Visualization Reference Model • Apply to Specific Domains of Interest to NATO • Counterterror Intelligence • Requirements • Functionalities and technologies • Indicate R&D Directions • Rate technology maturity • Encapsulate in matrix form
Overview • Syndicate 4 Approach • Visualization Reference Model • Counter Terror Intel Requirements • Capabilities and Technologies
Visualization Reference Model • Similar to VisTG model, Martin Taylor • Focus on Computational Engines for Data Analysis and Presentation
Visualization: The “3D Metaphor” • 2D Visualization Extremely Effective • Decades-long Effort in Scientific Visualizaton Has Resulted in 3D Visualizaton Toolkits • Toolkits work well for problems that map to 3D geometry + time and a few other parameters • 3D metaphor nScope Fourth Planet, Inc. AVS/Express Advanced Visual Systems, Inc. Vis5D University of Wisconsin
Visualization: The “Hard” Problems • Limits of the 3D Metaphor • Is the 3D metaphor the key to understanding? • How can many, varied kinds of information be visually fused, coherently displayed and manipulated? • How can information qualities be portrayed? • uncertainty • timeliness • accuracy • . . . • How can abstract, multi-dimensional data sources be displayed? • financial • proteiomics • counter terror intel • . . .
Visualization:A Multi-Disciplinary Look • What Is an “Information Workplace”? • How Can the Design of Visualization Tools Make Use of Knowledge About Human Perception and Cognition? • How Can Human Perceptual and Cognitive Talents Be Enhanced and Amplified Through Visualization? • How Can the Long and Rich History of Visualization in the Arts Be Exploited in the Information Age? • Much Visualization Algorithm Automation — What About Automation of HMI Components?
“Show me what I need to know, when I need to know it!” • The Only Way to Do That Is by Integrating Knowledge About • You, • Your situation(s), and your • Tasks and decision(s)
Ontology-Based Computing • 21stCentury Approach to Human-Centered Computing • Integrate Human-Centered Knowledge into Computation • Who am I? • Where am I? • on the planet? • on the network? • What am I trying to do? • What do I need to know? • What resources are available? • What don’t I know? • Am I fatigued? Stressed? Working too hard?
Interactive Visualization Incoming Data Knowledge Components Domain Abstractions Decision Requirements Decision-Centered Visualization Agents Monitor & Alert Automatic Tailoring Association Engine Decision Focus Presentation Manager Narrative Theory Classify, Prioritize, Associate Incoming Data Multimedia Displays • View Control • Interactive Commands & Queries Interaction Cycle Domain Ontology Task Level Multimodal HMI Interaction Dialog
Entity Knowledge Task and Decision Knowledge
Overview • Syndicate 4 Approach • Visualization Reference Model • CounterTerror Intel Requirements • Capabilities and Technologies
CounterTerror Intel Requirements “Before we can connect the dots, we first have to collect the dots.” - Technology Review, March 2003 • Intel Data Must Be • Gathered • Analyzed • Presented • Intel Data Collection and Sensor Technologies Outside Syndicate 4 Scope • Intel Data Sources Identified
Intel Data Gathering and Analysis Is Controversial in Democratic Societies • DARPA Total Information Awareness • Who Are We Tracking? • How Much Is Too Much?
CounterTerror Intel Data Sources • Communications • Email, Phone, FAX, Radio, Video, . . . • Open Sources • Newspapers, WWW, Newsgroups, TV, . . . • Commercial Transactions • Individuals • Organizations • Behaviors • Individuals • Organizations
CounterTerror Intel Data Analysis • Data Magnitude Requires Focus on Suspect Populations • Step 1: Feature Recognition • Far Too Much Raw Data to Process • Data reduction = (Feature Recognition Filter) • Content Analysis • Arbitrarily complex algorithms and software • Automation • Human-in-the-loop • Link analysis • Data mining • Behavior analysis • Presentation • Identify visualization and HMI issues
What Are We Looking For? • Are We Trying to Find Patterns Among Suspect Individuals and Organizations? • Surveillance restricted to suspect populations • Look for target (known?) patterns • Are We Trying to Identify Suspects From Anamalous Patterns? • Watch everyone • Look for target(?) patterns • Look for anomalies • What’s anomalous?
Overview • Syndicate 4 Approach • Visualization Reference Model • CounterTerror Intel Requirements • Capabilities and Technologies
CounterTerror Intel Data Analysis • Feature Recognition • Communications • Open Sources • Commercial Transactions • Behaviors • Link Analysis • Data Mining • Behavior Analysis
Feature Recognition and Communications • Email, Phone, FAX, Radio, Video • Many easily recognized parameters • Source, destination(s), length, encrypted(?), language, subject field, attachments, routing, etc. • Content analysis • Textual concept recognition • High in some languages • Low for multilingual • High OCR • High speech recognition • Low image and video feature recognition • Low intent recognition
Feature Recognition and Open Sources • Newspapers, WWW, Newsgroups, TV, . . . • Domain of Discourse Constrained by Context • High Concept Recognition Technologies • NL concept recognition technologies • NL paraphrasing • Low Intent Recognition Technologies
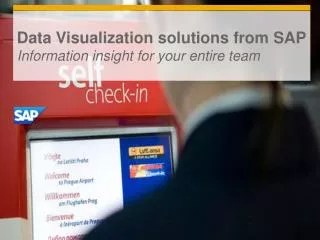
Visualization of Concepts in the Nixon-Watergate Transcripts
Feature Recognition and Commercial Transactions • Transaction Signatures • Customer ID • Credit card # • Product(s) purchased • Amount of product purchased • Purchasing frequency and history • . . . • Data Sources • All signature parameters maintained by merchants • Subject to data mining
Feature Recognition and Behaviors • Scope • Data magnitude requires focus on suspect populations • Suspect population • Behavior Signatures • Phone calls • Recipient and locations • Travel • Residence • Biographical data • . . . • Data Sources • Current law enforcement surveillance methodologies
Counterterror Intel Analysis • Feature Recognition • Communications • Open Sources • Commercial Transactions • Behaviors • Link Analysis • Data Mining • Behavior Analysis
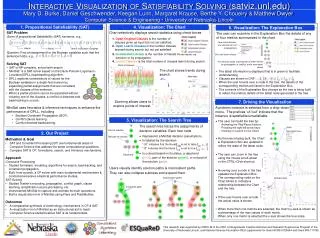
Link Analysis • Find Patterns in Recognized Features • Relations among people, organizations, events, incidents, behaviors, locations • Some Tools Available • Automated • Human-in-the-loop visualization • Medium Technology Maturity • Both Automated and Human-in-the-Loop Link Analysis Tools Require Further R&D Including Visualization and HMI
Example Link Analysis+ • NORA™ • Non-Obvious Relationship Awareness ™ • Systems Research & Development • http://www.srdnet.com/ • Commercial fraud detection now in use by FBI and . . . • NORA™ uses SRD's Entity Resolution™ Technology to Cross-reference Databases and Identify Potentially Alarming Non-obvious Relationships Among and Between Individuals and Companies
Data Mining • Search and Exploit (Legacy?) Databases • Recognized features • Others . . . • Mining Structured Data • E.g., commercial transaction data • Off-the-shelf technologies available but difficult to use • High maturity but visualization and HMI development required • Mining Unstructured Data • Low maturity • Data representation and association, automation tools, HMI and visualization require major R&D
Behavior Analysis • Compare Events With ‘Normal’ (Baseline) Information Stored in a Knowledge Base • Scope • Suspect entitities • Low technology maturity • Many components available but major integration engineering required • Robust and reliable monitoring technology not available • Prohibitively high false alarm rate • Human-in-the-loop signal detection • Visualization and HMI R&D
Analysis of Vessel Behavior • Scope • Track known entities • Behavior Baselines • Filter • Source • Destination • Cargo • Time • Subject to Vagaries of International Commerce
Agents Monitor & Alert Data Humans Monitor and Alert Behavior Analysis (cont’d) • Objective Distributed Technology • Regional, local, on-site, transportable Suspect Population Data Base Knowledge Base Behavior Baselines Visualization HMI
Summary • Link Analysis and Data Mining Are “Low Hanging Fruit” • Technologies “almost there” and potentially most productive in generating useful intelligence • Technology components exist but visualization and HMI are poor • Most difficult challenge is algorithm “scaling” • Technologies are evolving and may be influenced by N/X working group