Download
1 / 63
630 likes | 793 Vues
Review of Progress in the Development of Operational Upper Air Technology. May 2005. Introduction to Wind Profilers in the UK. John Nash, Upper Air Team Manager Observing Methods Technology Centre, Technology and Applied Science Met Office, Exeter, UK john.nash@metoffice.gov.uk.

E N D
Review of Progress in the Development of Operational Upper Air Technology May 2005
Introduction to Wind Profilers in the UK John Nash, Upper Air Team Manager Observing Methods Technology Centre, Technology and Applied Science Met Office, Exeter, UK john.nash@metoffice.gov.uk
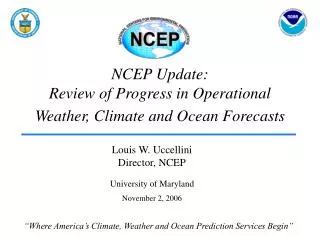
Introduction Progress will be reviewed for four different types of upper air system • Radiosondes – giving very detailed vertical profiles of temperature, relative humidity and wind • Wind profilers and Doppler weather radars, able to provide continuous monitoring of upper wind given suitable conditions • Microwave radiometers , able to provide continuous monitoring of temperature , water vapour and cloud properties in the lower troposphere, but with certain limits on vertical resolution • GPS measurements of integrated water vapour, able to provide continuous monitoring of integrated water vapour from a large number of sites.
General comments (1) • Groundbased remote sensing offers the chance of measurements at very high temporal resolution, but for temperature and humidity poorer vertical resolution than radiosondes • Is ground based remote sensing developed with research interests in mind or are the systems being moved towards operational applications? • Do operational meteorologists hinder development by lack of consistency in suitable specifications for systems, e.g. Should the customer provide the detailed techcnical specification for his solution, or just the required accuracy of the system ouptut + certain basic technical requirements? • Is the failure to produce many skilled upper air instrument specialists within the NMHS services hindering progress, with poor guidance being provided to manufacturers?
General comments (2) • Operational upper wind and temperature measurements from large commercial aircraft are of similar quality to some radiosonde systems. Relative humidity measurements are starting to become available in the US, see following talk by J. Stickland. • However, radiosonde and ground –based vertical soundings do have a viable future, since there are clearly areas in every upper air network where aircraft will never provide enough operational measurements. • The question of a viable market size for instrument manufacturers [ e.g. for wind profilers] and the impact on unit costs of drastically reducing the number of radiosondes in use should not be ignored by network planners.
Progress with radiosondes [as indicated by WMO High quality radiosonde test, Mauritius] • Small temperature sensors with rapid time constants of response allow daytime solar heating errors to be reduced to less than 1.5 deg C at 10 hPa , on many radiosondes. • At night , temperatures of the best radiosondes agree to within 0.3 deg C, as long as aluminized sensors are used to ensure minimal coupling to the infrared radiation fields. • Many relative humidity sensors now provide consistent results in both wet and dry conditions, with reasonably good agreement in vertical humidity structure down to temperatures of -70 deg C. • Most relative humidity sensors have a day-night bias of at least 5 per cent at high humidity in the tropics , and this problem has yet to be tackled properly.
Temperature and relative humidity compared shortly after launch in Mauritius at night
Temperature and relative humidity compared in the middle troposphere in Mauritius at night
Temperature and relative humidity compared through cloud above 5 km, daytime showing low bias in all sensors apart from the SRS
Temperature and relative humidity compared in the upper troposphere in Mauritius at night
Progress with radiosondes continued • Code correlating winds have good accuracy with low amounts of missing wind data • Radiosonde transmitters are narrow band and much more stable than in earlier generations, so WMO cannot be criticised for wasting spectrum by ITU • This has a by-product in that it is much easier to perform comparison testing with large numbers of radiosondes than in earlier years. • Height assignment errors at pressures lower than 100 hPa from pressure sensor errors can be eliminated by using GPS height measurements
Simultaneous geopotential height measurements from GPS sensors
Simultaneous geopotential height measurements from GPS sensors
Current problems [1] • The rapid change over to the new radiosondes is causing problems to many Members. Customers are reluctant to pay the price associated with upgrade. On the other hand manufacturers need to change techniques, e.g. soldering, and must use modern manufacturing technology to minimise production costs. • The customer cannot be expected to pay for endless upgrades , particularly when equipment was purchased as perfectly adequate only a few years ago. • The solution requires serious negotiation between the two parties, or external help from those with the necessary technical background.
Countries that wish to manufacture their own radiosondes • The radiosondes from these countries generally lag behind the measurement quality of the commercially available radiosondes • Better methods need to be devised by CIMO to encourage progress with the new designs currently being prepared for introduction.
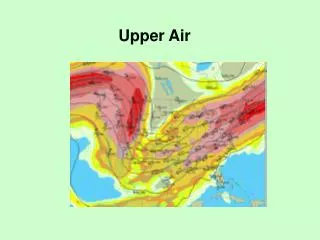
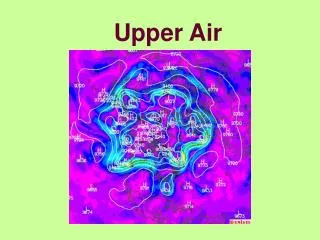
How do the wind measurements fit with winds from other systems?Example from Europe for 28 April 2005 Wind profilers + Doppler radar
00.UTC 10 km
10 km 12.UTC 10 km
00.UTC 2 km
12.UTC 2 km
Winds close to centre of typhoon approaching mainland Japan 50
New generation of profilers in Europeincorporating new hardware and software - DWD Nordholz
Some questions? • Should wind profilers cost as much as weather radars or do they need to be significantly cheaper? • Do wind profilers need to be as accurate as the best radiosondes or can larger random errors be tolerated? • How do users and manufacturers work together to keep costs down? • Are existing wind profilers positioned in the most beneficial localities?
Microwave radiometer • In the last three years the cost of multichannel microwave radiometers has begun to drop from about €400,000 towards €130,000. In the very long term , this technology may become very much cheaper than this… • The radiometers can provide temperature and relative humidity profile in the lower troposphere, with much less vertical resolution than a radiosonde , but with continuous monitoring. • The radiometers have now been improved with blowers to allow operation in light rain and drizzle. Integrated water vapour measurements are of good quality apart from in heavier rain. • Scan rates of the radiometers have improved so that sampling is now more appropriate for measuring cloud properties such as total liquid water content plus profiles of liquid water, • In the UK, the radiometers have been very reliable in deployment needing little maintenance intervention.
Radiometrics MP3000 Microwave Radiometer • 7 Channels: 51-59 GHz • O2 band - temp. profile • 5 Channels: 22-30 GHz • H2O line - humidity, cloud • Infrared Radiometer • Pressure, temp., RH sensors • Dew Blower & Rain Sensor • Automatic Calibrationblack body, noise diode • Zenith and Elevation Scans • Zenith, ±60°, ±70°, ±75° • Observation Cycle: 1 min Radiometrics MP3000 Microwave Radiometer at Camborne
Surface T 02 Radiosonde measurements 04 Surface U 95 Cloud liquid water Surface p Cloud liquid water IR Temp Int. water vapour
08 95 915 MHz wind profiler signal to noise depends on refractive index gradient Possibility of improving radiometer profiles being investigated in COST 720
Improved Sample Speed of Radiometrics MP3000 is necessary for cloudy conditions
Radiometer Comparing Retrieved Profiles with Observations Radiances Atmosphere GHz Neural Network Profile
RAOB BIAS 22.2 23.0 23.8 26.2 SPECTROSCOPY BIAS? Observed – calculated Brightness temperature [k] 30.0 51.2 52.3 53.9 CAL. BIAS 54.9 56.7 57.3 58.8
Statistics of Retrieved Profiles Results from 132 cases 5/11/03-20/1/04 v2.23
Radiometer Physics HATPRO • Filter bank Design – Fast! • 22-29 GHz – humidity/cloud • 51-58 GHz – temperature • Beamwidth: 3.5 at 22 GHz • Radiometric noise: 0.3-0.4 K rms at 1.0 s integration • Absolute system stability: 1.0K • Thermal stability: < 0.02 K • Rain sensor and shutter (including a dew-blower) • Integrated PC on-board • GPS clock • Pressure, humidity, temperature sensors • Optional IR-radiometer • Frequency extension possible by tandem operation • “Low cost”! Humidity And Temperature PROfiler Radiometer Physics’ HATPRO
Calibration Differences MP3000-HATPRO Estimate of HATPRO - Modelled radiosondes Average Differences between MP3000-Modelled sondes and MP3000-HATPRO in clear skies during HATPRO trial 10/11/04-3/1/05, Camborne (12 cases)Error bars indicate standard errors of averages.
Microwave radiometers will probably be used in conjunction with other sensing systems in future. • The COST 720 Integrated profiling project expects a combination of :- microwave radiometer laser ceilometer surface measurements cloud radar to provide estimates of cloud structure/liquid water content + temperature and relative humidity profiles. Use with wind profiler/ and or weather radar signals is also to be investigated
Laser ceilometer COST 720, TUC experiment, Payerne ,November 2003
GPS water vapour • Needs GPS antenna installed on stable mount with good horizon and minimal multipath reflections, i.e. GPS cannot be readily reflected into the antenna from nearby surfaces, see next slide • GPS receiver must process signals at two frequencies to allow compensation for signal delays in the ionosphere, see following slide • Receiver needs realtime communications to a central processing centre • In order to compute integrated water vapour amount it is essential to measure atmospsheric pressure at the antenna height, and it is helpful
GPS sensor installed by Met Office at South Uist wind profiler site
How to afford a detailed network with spacing between sensors less than 70 km?? • Installation of receiver + purchase of receiver costs about £15,000, so it is too expensive for the Met Office to install a widespread network • All wind profilers in the UK have a collocated GPS sensor since the combination of wind + water vapour measurement at high temporal resolution is much more useful than water vapour on its own • UK network has now increased to more than 70 sites , because of a memorandum of understanding with the UK national mapping Agency [Ordnance Survey], where the Met Office hosts some of the Ordnance Survey sensors at some automatic weather station sites. In return Ordnance Survey allow access to the data from all their sites in the UKas collected at the HQ in Southhampton.
The capability of the GPS network across the British Isles is illustrated by hourly measurements associated with a warm and then a cold front crossing the British Isles in April 2005 • These measurements were delivered to users 45 minutes after the end of the sample period. Processing was performed at Nottingham University on a system to be reinstalled at the Met Office in May 2005. • The plots are contoured at 2 kg.m-2 intervals, with 21 kg.m-2 corresponding to saturation with respect to water in the warm sector and 17 kg.m-2 to saturation in the colder air. • Random error in the water vapour measurements is expected to be about 1 kg.m-2corresponding to an average random error in relative humidity of between 5 and 6 per cent at these temperatures