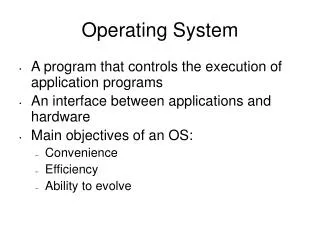
Advanced Local and Remote Kernel Debugging Techniques in Windows
90 likes | 208 Vues
This guide explores the intricacies of local and remote debugging of the Windows kernel. It discusses the limitations of live local kernel debugging in Windows 7 and the importance of obtaining dump files for analysis. The document illustrates how to use LiveKD to capture a snapshot of kernel memory without halting the system, and it covers the potential of remote debugging with multiple machines to gather the latest crash logs. Additionally, it provides essential commands and breakpoints for efficient debugging, highlighted with practical examples for application developers.

Advanced Local and Remote Kernel Debugging Techniques in Windows
E N D
Presentation Transcript
CS4540 Operating System Local/Remote Windows Kernel Debugging Davion Teh| Kelvin Yeap Dillon Burton | Rodney Dulin
Local Debugging • Not possible to do live local kernel debugging in windows 7 • “You can’t dissect yourself while you’re conscious” • - True facts
LiveKD Local Debugging • Gets a “snapshot” dump file of the local kernel memory (does not stop kernel) • Debug the “snapshot” dump file with windbg/kd
Remote Debugging • Possible to achieve live kernel debugging (downside - requires 2+ machines) • Able to get NEWEST logs from crashes
Remote Debugging -2 • Useful when developing an application running on a web server or client with different environment than the host • Significantly shortens time spent to find faults • Get to have fun crashing debuggee manually (hint: “.crash”)
Breakpoints • bp (set breakpoint) • Bu (set unresolved breakpoint) • Bm (set symbol breakpoint) • Bl (list breakpoints) • Bc [id] (clear breakpoint)
1)Run VM 2)Immediately run the command below: Windbg –b –k com:port=\\.\pipe\<pipename>,pipe 3)Enter “g” in Windbg (and press enter,thanks) 4)Once window loads, open notmyfault.exe 5)do HighIRQL crash 6)!analyze –v 7) Copy those info (from notmyfault to end)
Links related to windbgdebugging Windbg standard debugging guide http://msdn.microsoft.com/en-us/library/windows/hardware/hh439390(v=vs.85).aspx http://msdn.microsoft.com/en-us/library/windows/hardware/hh439387(v=vs.85).aspx Windbg specialize debugging guide (related to cs4540)