Download
1 / 42
420 likes | 543 Vues
This document outlines essential aspects of Randomized Controlled Trials (RCTs) as a method for impact evaluation. It covers what makes an RCT, including the importance of random assignment, common concerns such as costs and ethical considerations, and key technical components including sample size and effect sizes. The goal of RCTs is to determine the impact of interventions by comparing outcomes with and without the program. Proper planning and execution are vital for successfully evaluating programs and informing future policies.

E N D
Randomized Control Trials (RCTs):Key Considerations and Technical Components Making Cents 2012 -Washington DC
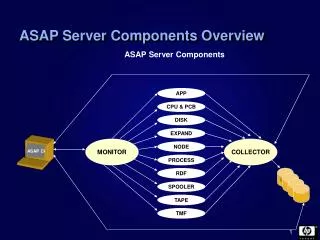
Outline • What makes an RCT • Common Questions and Concerns • Key Considerations • Technical Components • Evaluation Example
What makes an RCT Impact evaluation is one type of program evaluation Randomized Control Trial is one type of impact evaluation
What makes an RCT • Goal: todocument the impact of a program or intervention • Did the program change lives? What would have happened if the program hadn’t existed? • Compare: • what happened and • what would have happened without the program aka the counterfactual
What makes an RCT • Defining feature: random assignment of units • individual beneficiaries, schools, health clinics, etc to treatment and control groups • allows us to assess the causal effects of an intervention
Questions and Concerns • Expensive • Sample size • Program started • Ethics • Technical capacity
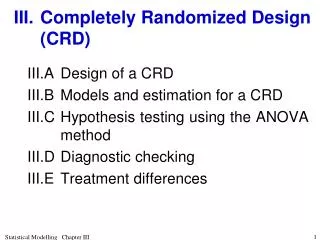
Key Considerations • What types of questions? • Specific – targeted, focused: test a certain hypothesis • Testable - has outcomes that can be measured • Important - will lead to lessons that will affect the way we plan or implement programs • Micro – macro, expansive questions not appropriate
Key Considerations • Right project to evaluate? • Important, specific and testable question • Timing--not too early and not too late • Program is representative not gold plated • Time, expertise, and money to do it right • Results can be used to inform programming and policy
Key Considerations • Right project to evaluate? • Plan and randomize before the program starts • Randomly assign who gets the program • Evaluation design should occur with project design • Need sampling frame on intended subjects • Randomize after the baseline survey
Key Considerations • Not the right project? • Premature and still requires considerable “tinkering” to work well • Too small of a scale to compare into two “representative groups” • Unethical or politically unfeasible to deny a program while conducting evaluation, ie if a positive impact proven • Program has already begun and not expanding elsewhere • Impact evaluation too time-consuming or costly and therefore not cost-effective
Key Considerations Intervention starts Impact Primary Outcome Counterfactual Timing Have to do randomization before program starts
Technical Components: Sample • Sample size and unit of randomization Sample size determined by effect size
Technical Components: Effect sizes Define effect size that is “worthwhile” What is the smallest effect that should justify the program being adopted? If the effect is smaller than that, it might as well be zero: we are not interested in proving that a very small effect is different from zero In contrast, if any effect larger than that would justify adopting this program: we want to be able to distinguish it from zero Statistical significance vs policy significance
Technical Components: Effect sizes Program manager: “We think our program will increase average income by 20%” Researcher: “OK. That’s equivalent to an effect size of… (frantically calculates)… 0.4 standard deviations… which means you need a sample size of… 2200 beneficiaries.” (Time and money is spent on data collection, monitoring intervention, etc etc. One year passes.) Researcher: “Well, we did not find a 20% increase in income. Maybe you should scrap the program.” Program manager: “WAIT!! The program is still worthwhile if it only increases income by 10%!!” Researcher: “Ooops. We don’t have the power to detect that. We would have needed a sample size of 6000..” Punchline: Define effect size that is “worthwhile”… NOT what you think will happen
Technical Components: Sample • Individual level • If expecting .2 effect size • one intervention as compared to control • .8 power – 770 people • .9 power – 1040 people • two interventions as compared to control • .8 power – 1150 people • If expecting .1 effect size • one intervention as compared to control • .8 power – 3150
Technical Components: Sample • Cluster level • If expecting .2 effect size - one intervention • With Clusters of 10 people .8 power – 115 clusters • With Clusters of 20 people .8 power – 80 clusters • lf expecting .2 effect size - two interventions • With Clusters of 30 ppl .8 power – 65 clusters • Clusters of 50 ppl .8 power – 56 clusters
Technical Components: Randomization • Clients/beneficiaries are randomly assigned to receive the program or different program models • Everyone has an equal chance of being assigned to all groups • The only difference between the two groups is whether they are assign to receive the new service Potential Beneficiaries Randomization Treatment (receive program) Control (no or delayed program)
How do we normally select participants HQ Closest to the main roads? Biggest advocate for program services? Greatest need? Not served by other organizations?
Random assignment Randomization allows us to be sure we have a reliable and similar comparison group. When everyone had an equal chance of getting the program and randomization worked – we have our counterfactual. We know what would have happened without the program. We know outcomes in blue villages are similar to outcomes in red villages. Pre-program
But how can we be sure they are similar Income per person, per day in leones, before the program 5000 0 0 10,057 10,057 Treat Compare
What non random assignment might look like HQ Income per person, per day, leones 5000 0 12470 8990 Blue villages don’t make a good counterfactual. These villages are different. They are better off. Treat Compare
Pre-program income – randomized Income per person, per day in leones, before the program 5000 0 0 10,057 10,057 Treat Compare
Post-program income – measure impact Income per person, per day, after the program 14590 IMPACT 5000 0 10570 Post-program and impact Treat Compare
Technical Components: Randomization Intervention Impact Primary Outcome Counterfactual Time Randomization is unique – it gives us this reliable counterfactual
Random Sampling vs. Random Assignment • Random Sampling: each individual has the same probability of being included in the sample • Only survey/interview some households out of a community • May select representative sample of villages out of district • Can select random sample and conduct needs assessment • Random Assignment: each individual is as likely as any • other to be assigned to the treatment or control group – • gives us comparison group to measure impact
Random sampling and random assignment Randomly sample from area of interest (select some eligible participants/ villages) Randomly assign to treatment and control out of sample Randomly sample for surveys (from both treatment and control)
Mechanics of randomized assignment • Need pre-existing list of all potential beneficiaries • Many methods of randomization • Public lottery • Selection from hat/bucket • In office private • Random number generator • Computer program code • Staggered/phase-in • Rotation • Pulling names/communities out of a hat to select program beneficiaries is random assignment
Multiple treatments: comparing programs Treatment 1 Treatment 2 Treatment 3
Phase-in design: slow program roll out 3 1 Round 1 Treatment: 1/3 Control:2/3 2 3 3 3 1 3 3 1 1 3 Round 2 Treatment: 2/3 Control:1/3 1 3 3 3 3 3 1 1 Randomized evaluation ends 1 2 2 2 1 1 3 3 3 2 1 2 2 2 2 2 2 2 2 2
Technical Components: Ethics • Program proven to work • Sufficient resources • Doing harm • Clear expectations • Transparent process
Technical Components: Budget • Impact evaluations require a significant budget line • $30,000 - $400,000 • The budget is influenced by • Sample size • Numbers of waves of data collection • Logistical costs in-country • Methods of data collection • PDAs vs. paper-based tools • Length of tool • Qualitative vs. quantitative • Staffing
Overall Goal: Evidence Based Policy Needs Assessment Process Evaluation Impact Evaluation Cost Benefit Analysis Opportunity costs of money Quantification of costs Benefits Cost-Benefit Analysis
Example: Cash transfers for vocational trainingThe Northern Uganda Social Action Fund (NUSAF)
NUSAF “Youth Opportunity Program” Cash grants of about $7000 per group ($377/person) Intended for acquiring vocational skills and tools Goals: Raise incomes and employment Increase community cohesion and reduce conflict Build capacity of local institutions Experiment: Groups randomly assigned to receive the grant
Average age: 25 Average education: 8th grade Average cash earnings: $0.48/day PPP Average employment: 10 hours/week Female: 33%
Program allocated by lottery among eligible applicants 535 groups, with 18,000 youth 265 treatment groups receive grant 270 groups assigned to a control group
Timeline of events 2006 Tens of thousands apply, hundreds of groups funded 2007 Funds remain for 265 groups in 10 districts Government selects, screens and approves 535 groups 2/2008 Baseline survey with 5 people per group Randomization at group level 7-9/2008 Government transfers funds to treatment groups 10/2010 Mid-term survey commences roughly 2 years after transfer Effective attrition rate of 8% 2/2012 Next survey planned
The Results • Economic Outcomes: • Improved Employment, Incomes and High Returns on Investment • Social Cohesion, Reconciliation and Conflict: Improvements for Men, Mixed Results for Women • Governance and Corruption: • No Evidence of Widespread Leakage
Thank you QUESTIONS kbidwell@poverty-action.org Poverty-action.org