Graphing Rational Functions with Asymptotes
Learn how to graph rational functions of the form y=ax+b/cx+d and analyze domain, range, and asymptotes. Explore multi-step problems involving 3-D printers and average costs per model.

Graphing Rational Functions with Asymptotes
E N D
Presentation Transcript
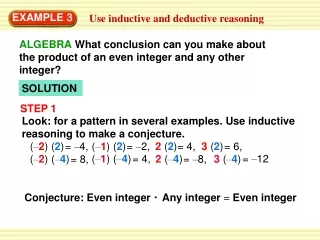
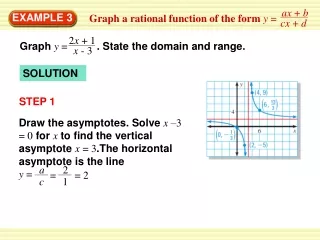
Graph a rational function of the form y = Graph y = . State the domain and range. ax + b 2x + 1 cx + d x - 3 Draw the asymptotes. Solve x –3= 0 for xto find the vertical asymptote x = 3.The horizontal asymptote is the line y = = = 2 a 2 c 1 EXAMPLE 3 SOLUTION STEP 1
Graph a rational function of the form y = STEP 2 ax + b Plot points to the left of the vertical asymptote, such as (2, –5) and , ),and points to the right, such as(4, 9) and( ). cx + d 13 6, 3 1 (0 – 3 ANSWER The domain is all real numbers except 3. The range is all real numbers except 2. EXAMPLE 3 STEP 3 Draw the two branches of the hyperbola so that they pass through the plotted points and approach the asymptotes.
• Write an equation that gives the average cost per model as a function of the number of models printed. EXAMPLE 4 Solve a multi-step problem 3-D Modeling A 3-D printer builds up layers of material to make three dimensional models. Each deposited layer bonds to the layer below it. A company decides to make small display models of engine components using a 3-D printer. The printer costs $24,000. The material for each model costs $300.
Unit cost • Number printed + Cost of printer c = Number printed 300m + 24,000 m = EXAMPLE 4 Solve a multi-step problem • Graph the function. Use the graph to estimate how many models must be printed for the average cost per model to fall to $700. • What happens to the average cost as more models are printed? SOLUTION STEP 1 Write a function. Let cbe the average cost and mbe the number of models printed.
Graph the function. The asymptotes are the lines m =0 and c = 300. The average cost falls to $700 per model after 60 models are printed. EXAMPLE 4 Solve a multi-step problem STEP 2 STEP 3 Interpret the graph. As more models are printed, the average cost per model approaches $300.
x – 1 4. y = x + 3 domain: all real numbers except –3, range: all real numbers except 2. ANSWER for Examples 3 and 4 GUIDED PRACTICE Graph the function. State the domain and range. SOLUTION
2x+1 5. y = 4x –3 SOLUTION 1 1 2 2 domain: all real numbers except , range: all real numbers except . ANSWER for Examples 3 and 4 GUIDED PRACTICE Graph the function. State the domain and range.
–3x+2 6. f (x) = – x –1 domain: all real numbers except – 1 , range: all real numbers except 3 . ANSWER for Examples 3 and 4 GUIDED PRACTICE Graph the function. State the domain and range. SOLUTION
ANSWER Sample answer: In the function, 24,000 is replaced by 21,000. On the graph, the asymptotes remain at m = 0 and c = 300, but the values decrease from a smaller starting point. for Examples 3 and 4 GUIDED PRACTICE 7. What If? In Example 4, how do the function and graph change if the cost of the 3-D printer is $21,000?