Supplementary Material
This study investigates how the environment formed by transposable elements (TEs) affects gene length and expression in human genes. Using mapping of transcriptional units (TUs), we analyze TE fractions within these units and their correlation with gene length across diverse tissues. The findings reveal significant trends in the distribution of TE classes, particularly the predominance of short TEs. Additionally, chi-square analysis highlights tissue-specific expression patterns, especially among blood-related and nervous tissues, in MIR-rich gene expressions.

Supplementary Material
E N D
Presentation Transcript
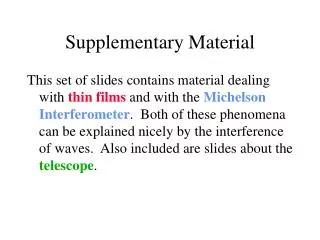
Supplementary Material Effect of the transposable element environment of human genes on gene length and expression Daudi Jjingo, Ahsan Huda, MadhumatiGundapuneni, Leonardo Mariño-Ramírez and I. King Jordan A B TE fractions Supplementary Figure S1 – Demarcating transcriptional units on the genome and Mapping TEs to TUs (A)Transcriptional units were mapped as genomic regions encompassing all overlapping transcripts, from the start of the 5’ most exon to the end of the 3’ most exon. (B) TE fractions in TUs were computed for each TE family as the number of base pairs occupied by a TE as a fraction of all base pairs in the TU. The figure shows the average TE fraction of each TE family in all the TUs.
Supplementary Table S2. Length distribution of TEs within genes. TEs classified based on whether they are long (>400bp) or short (>400bp). Almost all SINES are short, but there are significant numbers of the other TE classes or families that are long. Nevertheless an overwhelming percentage of TEs in genes are short.
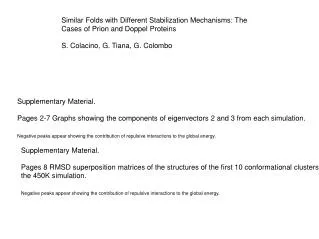
Alu B MIR A TE fractions C L1 D L2 TE fractions F E DNA LTR TE fractions Supplementary Figure S3. The relationship between TE fractions of genes and GL. Correlations of TE levels and gene length for all TE types. Each data point represents a bin containing 156 genes. The significant p-value of correlation by Bonferroni correction is 8.3 x 10⁻³ Log2 gene length Log2 gene length
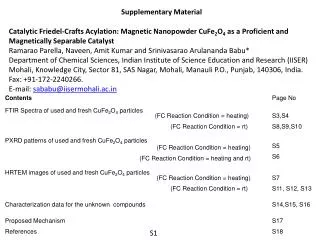
(Obs – Exp) / Exp Liver 721BLymphoblasts Heart PB-CD14+Monocytes BM-CD71+EarlyErythroid PB-CD56+NKCells Testis Placenta CardiacMyocytes LymphomaburkittsRaji Lung PB-CD19+Bcells SmoothMuscle Pancreas LymphomaburkittsDaudi SkeletalMuscle PB-BDCA4+DentriticCells BM-CD34+ BronchialEpithelialCells Ovary Kidney WholeBlood WholeBrain PrefrontalCortex PB-CD8+Tcells Spinalcord FetalBrain Tongue CaudateNucleus BM-CD33+Myeloid Adipocyte Amygdala Prostate AdrenalGland PB-CD4+Tcells Thalamus SuperiorCervicalGanglion UterusCorpus Thyroid Bonemarrow CerebellumPeduncles BM-CD105+Endothelial TestisInterstitial Trachea Cerebellum ColorectalAdenocarcinoma TrigeminalGanglion Ciliaryganglion Skin LeukemiaPromyelocytic(hl60) Uterus Appendix LeukemiaLymphoblastic(molt4) AdrenalCortex FetalLiver DorsalRootGanglion PituitaryGland FetalThyroid LeukemiaChronicmyelogenous(k562) Tonsil AtrioventricularNode SalivaryGland TemporalLobe Lymphnode PancreaticIslets Hypothalamus Thymus OccipitalLobe TestisLeydigCell CingulateCortex TestisGermCell SubthalamicNucleus FetalLung Globuspallidus OlfactoryBulb Pons ParietalLobe TestisSeminiferousTubule MedullaOblongata Supplementary Figure S4. Relatedness of tissues in which MIR-rich genes are maximally expressed. Chi-square analysis showing enrichment of certain related tissues (mostly blood tissues [blue]) and depletion of certain other related tissues (mostly nervous tissues [purple]) among tissues hosting the maximum expression of MIR-rich genes.