Using Graphical Representations of Business Processes in Evaluating Internal Control
120 likes | 367 Vues
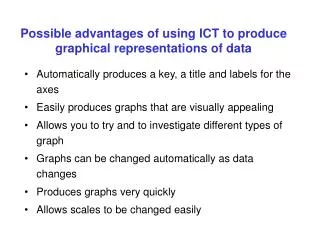
Using Graphical Representations of Business Processes in Evaluating Internal Control. Discussant comments: Malik Datardina, CA, CISA. Overall. Useful case Developing flowcharts, graphic representations of a process flow is a good thing to bring into class

Using Graphical Representations of Business Processes in Evaluating Internal Control
E N D
Presentation Transcript
Using Graphical Representations of Business Processes in Evaluating Internal Control Discussant comments: Malik Datardina, CA, CISA
Overall • Useful case • Developing flowcharts, graphic representations of a process flow is a good thing to bring into class • Good coverage of IS concepts (e.g. access mgmt, SDLC, spreadsheets, etc)
Learning objectives • Successful in demonstrating it’s core competency • But SOX is now steady-state • May want to link importance to continuing stream of compliance mandates (e.g. IFRS, PCI, etc) • Establish how unique the case is
Learning Objectives (cont’d) • Need additional support as to why BPD (instead of flowcharts) is important • Study cited in case noted that largest category of users (46%) used flowcharts
Design & Structure of Case Student Perspective • Case writers understood and effectively dealt with the fact that students will be overwhelmed by the material • Use of MCs, weaknesses table • Use of Excel, Word (Also, PowerPoint?)
Design & Structure of Case (cont’d) Instructor Perspective • Given popularity of flowcharts, authors may want to give instructor option of BPD vs flowchart (e.g. 96% of AIS and 92% of audit used flowchart) • Minor issue: provide more explicit instructions on what’s given to students and why
Design & Structure • Situational vs narrative • Successfully demonstrated how it’s better to use situational; i.e. since it’s closer to the real-world • Use of technology • Integrated use of publishing the case on the web, learning management system. • Good guidance on how to deliver the case in class
Content of the case • Situational style familiar to Canadian UFE writers; was used in cases in the past • Stands on its own merit • Flexibility: use for experienced and non-experienced students
Grading & Debriefing • Flowcharting/BPD: Overwhelming • Students not experienced with flowcharts/ BPD • Workshop approach was good • Not explicitly grading the diagram • May want to integrate as part of participation mark
Grading & Debriefing (cont’d) • Students experienced with flowcharts/ BPD • Peer review approach • Collaborative learning environment • May want to integrate as part of participation mark • Insights on teaching Gen-Y (aka Millenials)? • Out of scope, but gives insights
Teaching notes • Need to clarify how to grade the diagram • Reconcile with “non-grading approach” taken
Conclusion • Good case • Graphical representation skills are important • Real-world approach is good • Case can stand alone • Insights into the Millennials aka Web 2.0 generation