Year 10 Term 1 Higher (Unit 8 ) REFLECTION, ROTATION AND TRANSLATION
Year 10 Term 1 Higher (Unit 8 ) REFLECTION, ROTATION AND TRANSLATION. Key Concepts. Examples. A reflection creates a mirror image of a shape on a coordinate graph. The mirror line is given by an equation eg . The shape does not change in size.

Year 10 Term 1 Higher (Unit 8 ) REFLECTION, ROTATION AND TRANSLATION
E N D
Presentation Transcript
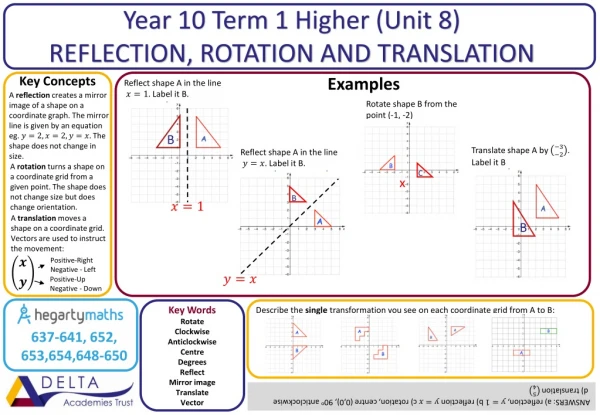
Year 10 Term 1 Higher (Unit 8) REFLECTION, ROTATION AND TRANSLATION Key Concepts Examples A reflection creates a mirror image of a shape on a coordinate graph. The mirror line is given by an equation eg. The shape does not change in size. A translation moves a shape on a coordinate grid. Vectors are used to instruct the movement: Translate shape A by . Label it B Rotate shape B from the point (-1, -2) (-1,-2), clockwise, 90o. Label it C. Reflect shape A in the line Label it B. Reflect shape A in the line Label it B. Positive-Right Negative - Left Positive-Up Negative - Down A rotation turns a shape on a coordinate grid from a given point. The shape does not change size but does change orientation. B B B C x Key Words Rotate Clockwise Anticlockwise Centre Degrees Reflect Mirror image Translate Vector Describe the single transformation you see on each coordinate grid from A to B: 637-641, 652, 653,654,648-650 ANSWERS: a) reflection, b) reflection c) rotation, centre (0,0), 90o anticlockwise d) translation
Year 10 Term 1 Higher (Unit 8) ENLARGEMENT Examples Key Concepts Enlarge by scale factor from point P. Enlarge shape A by scale factor 2 from point P. Enlarge by scale factor -2 from (0,0). An enlargement changes the size of an image using a scale factor from a given point. A positivescale factor will increase the size of an image. A fractional scale factor will reduce the size of an image. A negative scale factor will place the image on the opposite side of the centre of enlargement, with the image inverted. B B A A A B Key Words Enlargement Scale factor Centre Positive Negative Describe the single transformation you see on each coordinate grid from A to B: 637,638,650, 642-645, 651 ANSWERS: a) enlarge, centre (-4,2) scale factor 2 b) enlarge, centre (1,-2) scale factor c) enlarge, centre (0,1) scale factor -3
Year 10 Term 1 Higher (Unit 8) SCALES AND BEARINGS Examples Key Concepts The diagram shows the position of a boat B and dock D. Scales are used to reduce real world dimensions to a useable size. Calculate the real distance between the boat and the dock. A bearing is an angle, measured clockwise from the northdirection. It is given as a 3 digit number. b) State the bearing of the boat from the dock. 110o c) Calculate the bearing of the dock from the dock. because the angles are cointerior because angles around a point equal 360o 70o 290o 0 The scale of the diagram is 1cm to 5km. Key Words Scale Bearing Clockwise North Find the bearing of A from B (Diagrams not drawn to scale): a) b) 674-679,492-495 Links Geography ANSWERS: (a) 230o (b) 285o
Year 10 Term 1 Higher (Unit 8) CONSTRUCTIONS AND LOCI Examples Key Concepts Line bisector Shade the region that is: - closer to A than B - less than 4 cm from C Circle with radius 4cm Line bisector of A and B Angle bisector 0 Key Words Bisect Radius Region Shade There are two burglar alarm sensors, one at A and one at B. The range of each sensor is 4m. The alarm is switched on. Is it possible to walk from the front door to the patio door without setting off the alarm? 683,660-665, 674-679 1cm = 1m
Year 10 Term 1 Higher (Unit 3) TWO WAY TABLES AND STEM AND LEAF Examples Key Concepts A two way table is used to represent categorised data. Stem and leaf diagrams This two way table gives information on how 100 students travelled to school. A stem and leaf diagram orders large data sets. It can be used to calculate the median. 25 46 22 30 Always double check that your rows and columns add up to the total value. Must be ordered from smallest to largest A key must be included Median = 63.5 Key Words Two way table Stem and Leaf Median Compare Complete a two way table using this information: Felicity asked 100 students how they came to school one day. Each student walked or came by bicycle or came by car. 49 of the 100 students are girls. 10 of the girls came by car. 16 boys walked. 21 of the 41 students who came by bicycle are boys. Work out the total number of students who walked to school. 422-424,430-433
Year 10 Term 1 Higher (Unit 3) AVERAGES FROM A TABLE Examples Key Concepts Modal group (mode) Group with the highest frequency Median group Find the cumulative frequency of the frequency. The median lies in the group which holds the number Estimate the mean From grouped data the mean can only be an estimate as we do not know where the data lies in each group. Identify the modal group from this data set. Identify the group in which the median would lie. Using the cumulative frequency of the groups the 28th lies in the groups Estimate the mean of this data: Key Words Midpoint Mean Median Modal From the data: Identify the modal group Identify the group which holds the median Estimate the mean 414-418 ANSWERS: a) b) 13th value is in the group c)
Year 10 Term 1 Higher (Unit 3) STATISTICAL DIAGRAMS Examples Key Concepts Plot at the midpoint A frequency polygon is a line graph which connects the midpoints of grouped data. 10 12 A pie chart represents data into proportional sections. 16 16 What type of correlation is shown? Positive correlation b) Another student spent 6 hours revising for the test. Find an estimate of their test score. Draw a line of best fit and read from it - 68% c) Explain why it might not be sensible to use the scatter graph to estimate the score for a student that spent 15 hours revising. It is out of the data range. 19 A scatter-graph shows the relationship between two variables. Correlation is used to describe the relationships. Positive Correlation Negative Correlation No Correlation Key Words Midpoint Frequency polygon Pie chart Degrees Scatter graph Correlation Line of best fit 1) Draw a frequency polygon using this data. 2) Draw a pie chart using this data. 3a) What type of correlation is shown? b) The distance from London of a house is 22km. What is an estimate of the rent it will cost? 441,427-429, 453-454 ANSWERS: 2) Angles – 40, 70, 105, 100, 45 3a) Negative correlation b) Between £1200 and £1300