Download
1 / 64
640 likes | 740 Vues
Learn how to improve schools through data analysis, protocols, survey results, story examples, and effective solutions.

E N D
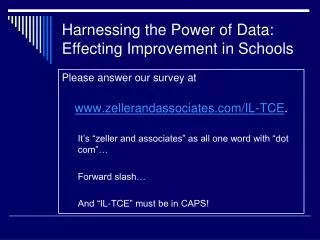
Harnessing the Power of Data: Effecting Improvement in Schools Please answer our survey at www.zellerandassociates.com/IL-TCE. It’s “zeller and associates” as all one word with “dot com”… Forward slash… And “IL-TCE” must be in CAPS!
Harnessing the Power of Data: Effecting Improvement in Schools Dr. Leslie R. Wilson Gerry Zeller February 2008
Agenda • Introductions • Protocols • Survey Report • Illustrative Story • The Process • Tools • Work • More Tools • Reflection and Evaluation
Survey Results • Why are you here? • Your School Improvement Involvement • Your Expertise
Know and be able to do • School Improvement = Problem Solving • Problem Solving = Process • District, School, and Classroom Levels
Targeted Concern There were approximately 15 students out of total student population of 1,000 that were dropping out of school when they reached their 16th birthday.
Hypotheses Generated • Young men leave school. • Low income students do not value education. • Students who get discipline referrals want out. • The lower the GPA, the more likely one is to walk. • Parents didn’t finish high school, children won’t. • Single parent families and similar find it difficult to shepherd students through school. • These students come to us with poor test scores. • These students earn too few credits. • These students are frequently tardy or leave early.
Determine and Collect Needed Data Gender SES Discipline Referrals GPA Parental Background Family Makeup Entry Test Scores Credits Attendance
Analyze Data Gender No SES: No Discipline Referrals: Yes GPA: No Parental Background: No Family Makeup: No Entry Test Scores: No Credits: Yes Attendance: Yes
Develop Solution Criteria • Diploma/GED (Rigor) • On Campus Program (Relationships) • Quick Successes (Relevance) • Non-traditional School Day (Relevance) • In-depth Knowledge of/Caring for Students (Relationships)
Investigate Solutions • Brainstorm: What ideas do we have? • SBR: What does research suggest? • Best Practice: What are other schools doing?
Select Best Match to Criteria: Late School • Diploma/GED • On Campus Program • Quick Successes • Non-traditional School Day • In-depth Knowledge of/Caring for Students
Implement Solution • Human Resources • A Multiple Certified Person • U of MO HS Extension • Material/Facility Resources • Classroom/Computer Lab • Policies/Procedures • Ineligible for Interscholastics • Application and Interview
Communicate Solution Constituencies • Formally • Informally
Monitor Progress • Method • Attendance • Credits • BehavioralContracts • Frequency • Responsibility
IIRC • Access e-Plan • Review District Data • State Report Card • Special Education Profile • Multiple Measures • PISA • TIMMS
IIRC Review School Data Top Comparables CPS School Profile Bernhardt’s Perception Surveys Local School Data Summative Assessment Data Behavioral Trend Data 32
Interactive Illinois Report Card: School • Performance Over Time • By Grade Level • By Subject Area • By Cohort • Comparison To Others • Scatter Plots • Compare Tool
High School “Perfect” Resources • College Board • http://www.collegeboard.com/splash • ACT • http://www.act.org/
Generate Hypotheses • Brainstorm (Bias and Consensus) • Eighth graders cannot do Math. • Eighth grade teachers cannot teach Math. • We do not use the appropriate eighth grade textbook. • The test is too hard. • Correlations • Steven D. Levitt and Stephen J. Dubner • Reading and Writing
Determine Needed Data • Sources of Data • Holcomb, Edie L.: Workbook, p. 5 • Bernhardt, Victoria L. Data Analysis for Continuous School Improvement. Larchmont, NY: Eye on Education, 2004. • ---. Using data to improve student learning in school districts. Larchmont, NY: Eye on Education, 2006.
On-line Survey Tools • Survey Monkey http://www.surveymonkey.com/ • Zoomerang http://info.zoomerang.com/ • Profiler Pro http://www.profilerpro.com/
Bernhardt Perception SurveysSocial – Emotional Measures • When I am at school, I feel:
Discipline Referral Tracking System (SIS/PBIS) • Student • Infraction • Reporter • Location • Day/Date • Time • Disposition • Etc.
The Five “W’s” • Who’s Learning, Who’s Not? • Why? • What’s Being Learned, What’s Not? • Why? • What Are You Going To Do About It?
See, Say, So • What do you SEE in the data? • What do you want to SAY about the data? • And SO what’s next? Dr. Jay Linksman
3 Whats • What? • So what? • Now what? Rick Prestley
The Five “Gets” • Get Data • Get Them Electronic • Get Them Disaggregated • Get Them Graphical • Get Talking (Bias and Consensus)
Get It Graphical: 2009 http://www.wordle.net/