Download
1 / 34
340 likes | 373 Vues
Engage Year 6 students in hands-on probability and data analysis activities. Explore concepts such as certainty, likelihood, 50:50 chances, and more through interactive exercises. Enhance learning with colorful visuals and engaging tasks.

E N D
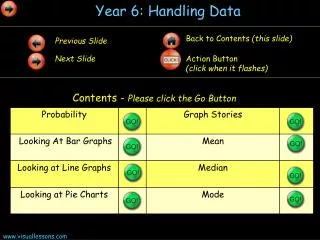
Back to Contents (this slide) Previous Slide Next Slide Action Button (click when it flashes) Year 6: Handling Data Contents - Please click the Go Button
Certain Something will definitely happen. Likely Something will probably happen, but it is not certain. 50:50 Chance Something has exactly half a chance of happening. Something is unlikely. It has more chance of not happening. Unlikely Probability. What are the chances of that? Impossible Something will never happen. Probability is all to do with how likely, or unlikely events are to happen.Click on the words to see what they mean.
Click on the statements to watch them being placed on the probability line It will snow in May 2012 is a leap year Year 5 will get homework It will rain in April The sun rises in the west Burnley win the FA Cup The moon orbits Earth Xmas will be in March Pick red card from a deck A coin lands on heads Certain Likely 50:50 Chance Unlikely Impossible
Probability Number Line ½ or 50% chance ¾ or 75% chance Certain 100% chance Impossible 0% chance ¼ of 25% chance Reveal Reveal Reveal Reveal Reveal • Rolling 7 on an ordinary 6 sided dice • Choosing one Year Group in a Junior School (Years 3 to 6) • Rolling an odd number on a dice • Choosing a red counter from a bag that has 6 red and 2 blue counters in it. • Choosing any card other than an Ace from a pack of cards
Probability Spinners There is a ¼ (25%) chance of the spinner landing on red. There is a ½ (50%) chance of the spinner landing on blue. There is a ¼ (25%) chance of the spinner landing on green. Click on the colour to find out the probability of the spinner landing on it.
There is a ¼ chance (25%) of the spinner landing on blue. There is a 1/8 chance (12.5%) of the spinner landing on yellow. There is a 1/8 chance (12.5%) of the spinner landing on red. There is a 3/8 (37.5%) chance of the spinner landing on green. There is a 1/8 chance (12.5%) of the spinner landing on purple. Click on the colour to find out the probability of the spinner landing on it.
Probability: Teacher’s Resource Add red ball Add yellow ball Add green ball Add blue ball Clear All
Probability Number Cards.Sanjay has eight number cards in his hands. This is what he has: 1 4 3 2 7 7 2 7 Which number is most likely to come up? Is it more likely to pick an even or odd number? 7 Odd (5/8) What are the chances of picking 2? What are the chances of picking 1 or 3? ¼ chance ¼ chance
Reveal the CardClick on the card to reveal what it is 4 ? 9 ? ? 4 5 ? ? 9 • There is a ½ chance the number is odd • There is 1/10 chance the card is 2 • It is twice as likely to pick a 4 than a 2. 5 ? ? 2 ? 8 ? 5 ? 8 • There is 1/5 chance of picking an 8. • There is a 7/10 chance of picking a number 5 or more.
Interpreting Graphs Approximately, how many people watched Swansea? Different football clubs have different attendances. This graph shows the average attendance for each club. 12,000 7,900 How many more people watched Bristol City than Brighton? 10,000 8,000 2,800 approx 6,000 Which club had about 7,300 watching them? 4,000 Barnsley 2,000 How many people watch Torquay? 0 1,800 approx Barnsley Brighton Swansea Torquay Bristol City
Creating a Climate GraphThis information shows the average temperature for each month. Click each month to show it on the graph. 26° 24° January 3° 22° February 4° 20° 18° March 8° 16° April 11° 14° May 16° 12° June 22° 10° July 26° 8° 6° August 24° 4° September 20° 2° October 15° 0° November 11° Jan Feb Mar Apr May Jun Jul Aug Sep Oct Nov Dec December 6°
Climate Graph: MoscowClick on each bar to reveal the monthly temperature. 22° 20° January -7° 18° February -6° 16° 14° March 0° 12° April 2° 10° May 9° 8° June 17° 6° 4° July 22° 2° August 21° 0° September 14° -2° October 6° -4° November 1° -6° December -5° -8° Jan Feb Mar Apr May Jun Jul Aug Sep Oct Nov Dec
Creating a Graph Here is some information that will need a different type of graph As this couple have two sets of numbers the best graph to draw is a line graph. This will help us to find out where we were at times like 10:45 too! Go to the next slide to see the graph. We timed the journey to our holiday destination. Here are our results:
80 60 Miles Travelled 40 20 0 12:00 11:00 11:30 9:00 9:30 10:00 10:30 Time of Day
Creating a Graph Here is some more information As this girl has two sets of numbers the best graph to draw is a line graph. This will help us read the temperature for the ‘odd number’ minutes too! Go to the next slide to see the graph. I timed how long it would take for the ice cubes to melt. Here are my results:
Start 85° 80° Water Temperature 75° 70° 65° 60° 55° Start 2 Mins 4 Mins 6 Mins 8 Mins 10 Mins 12 Mins Time
Interpreting GraphsSam measured his pulse as he did different exercises 90 80 Beats per minute What was Sam’s pulse after 1 minute? 70 How many minutes had passed when his pulse was 75? Between which minutes was Sam doing the hardest exercise? 60 What was Sam’s pulse at the start and end? 50 6 mins Time 4 mins 5 mins 0 mins 1 min 2 mins 3 min
Interpreting GraphsGeorgia measured the temperature outside for a day. Start 12° 10° Temperature 8° 5° 4° What times was it when the temperature was 8° What was the temperature difference between the coldest and warmest times of day? What was the temperature at 11am? What time of day was it the warmest? 2° 0° 8am 10am 12pm 2pm 4pm 6pm 8pm Time of Day
Pie Charts Show Pie Chart I asked my class of 25 children what their favourite pet was. Here are their results:
A pie chart to show 6T’s favourite TV programmes If 8 children liked Coronation Street, estimate how many children like Emmerdale? How many children are in 6T? Estimate how many children like watching films.
Questions Based on a Pie Chart: 6P’s Favourite Subjects Which subject is the least popular? Literacy 16 children like P.E. How many children like D.T.? 8 children Estimate how many children like Art. 2-4 children How many children are in the class? 32 children
Every Graph tells a Story The temperature throughout the year! Temperature Summer Months Winter months Months of the Year What do you think this graph is about?
Every Graph tells a Story The kettle boils and turns itself off A kettle boiling! The kettle heats up The water steadily and slowly cools down. Temperature Time What do you think this graph is about?
Every Graph tells a Story The parachutist is in the aeroplane A parachutist! He jumps out the plane. He opens the parachute Height He safely reaches the ground. Time What do you think this graph is about?
Every Graph tells a Story The noise level on the playground! Play time. Noisy children! Lunchtime Sound Level (Decibels) Lesson time. The playground is quiet. 12:30 10:30 Time of Day What do you think this graph is about?
Every Graph tells a Story Pulse rate before, during and after exercise! Exercising The pulse rate returns to normal. Exercise Stops Pulse Beforeexercise Time What do you think this graph is about?
Every Graph tells a Story The story of bathtime! Person stays in the bath Tap is turned off Water drains away Person climbs out of the bath Person climbs into the bath Water Level Filling the bath with water Time What do you think this graph is about?
Finding the Mean of a Set of Numbers = 24 3 6 4 5 2 4 24 ÷ 6 = 4 total how many numbers The mean (average) of all these numbers is 4. The ‘mean’ is the same as average. To find the mean, we have to add up all the numbers: Then we have to divide this total by however many numbers we had...
Finding the Mean of a Set of Numbers Peter 20 3 12 5 10 50 ÷ 5 = 10 Jessica 8 15 17 10 50 ÷ 4 = 12.5 Lucy 2 8 9 50 3 6 78 ÷ 6 = 12 Peter, Jessica and Lucy are playing darts. Can you work out their mean score? As Jessica has the highest mean score, it could be said that she is the best darts player!
Finding the Median of a Set of Numbers 3 6 4 5 2 4 This is the midway point. The median of all these numbers is 4. The ‘median’ is the number in the middle. To calculate the median, first we have to put the numbers in order.
Finding the MedianCatherine picks eight number cards. 8 4 5 2 9 7 2 7 Order Cards 2 2 4 5 7 7 8 9 Show Median Halfway between 5 and 7 is 6
Finding the Mode of a set of numbers 3 6 3 5 8 3 3 2 3 5 2 5 6 3 8 6 The mode is 3. It has come up the most! (6 times) The ‘mode’ of a set of numbers means which number has come up the most. Have look at these numbers...
Median, Mean and ModeLook at these number cards. Can you calculate the mean, median and mode? 5 4 7 2 9 7 1 1 2 3 5 7 7 9 The total is 35. 35 ÷ 7 = 5 The mean is 5. The halfway number is 5. The median is 5. Number 7 comes up the most. The mode is 7. Show Mode Show Mean Show Median
Teacher’s Resource: Mean, Median and Mode 5 4 Add 1 8 2 8 4 Add 6 1 4 4 2 9 3 2 7 2 Add 2 Add 7 7 6 1 5 4 5 1 8 7 6 Add 3 9 Add 8 8 6 3 9 6 8 7 7 6 5 2 Add 4 Add 9 1 6 5 3 4 7 3 9 9 Add 5 5 Clear All 8 3 1 1 2 9 3