Download
1 / 65
670 likes | 933 Vues
Chapter 22 Cities and Sustainability. Core Case Study: The Ecocity Concept in Curitiba, Brazil. Ecocity , green city : Curitiba, Brazil Bus system: cars banned in certain areas Pedestrian walkways, bike routes Only high rise building allowed near major bus routes

E N D
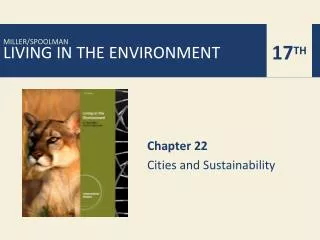
Chapter 22 Cities and Sustainability
Core Case Study: The Ecocity Concept in Curitiba, Brazil • Ecocity, green city: Curitiba, Brazil • Bus system: • cars banned in certain areas • Pedestrian walkways, bike routes • Only high rise building allowed near major bus routes • Bottom 2 floors to stores • industrial parks • Outside of town • Recycling of materials • 70% paper recycled, 60% metal, glass, plastic • Helping the poor • Free medical, dental, childcare, job training, feeding centers • Build-it yourself program • New challenges • Increased pressures from population growth
Solutions: Bus Rapid Transit System in Curitiba, Brazil Fig. 22-1, p. 586
City center Route Express Interdistrict Direct Feeder Workers Fig. 22-1b, p. 586
Half of the World’s People Live in Urban Areas (1) • Urbanization • Creation and growth of urban and suburban areas • Measured by percentage of people who live in such areas • Urban growth • Rate of increase of urban populations • Two ways: • Natural increase: births>deaths • Immigration from rural areas • Pushed • Pulled
Half of the World’s People Live in Urban Areas (2) • Push factors • Poverty • Lack of land to grow food • Declining labor market in agriculture • War, famine, conflicts • Pull factors • Jobs, food, housing • Education • Health care
Half of the World’s People Live in Urban Areas (3) • Four major trends • Proportion of global population living in urban areas is increasing • Number and size of urban areas is mushrooming • Megacities (>10 million) – 18 currently • Hypercities (>20 million) - Tokyo • Urban growth slower in developed countries • Poverty is becoming increasingly urbanized; mostly in less-developed countries • Slums, shantytowns
Urban Shanghai, Suburban Southern California, and Rural Malawi Fig. 22-2, p. 588
Urban Population Growth Fig. 22-3, p. 588
5 4 World 3 Urban population (billions) 2 Less-developed countries 1 More-developed countries 0 1950 1960 1970 1980 1990 2000 2010 2020 2030 Year Fig. 22-3, p. 588
Global Outlook: Satellite Image of Major Urban Areas Throughout the World Fig. 22-4, p. 589
Delhi 18.6 million Hong Kong 15.8 million Beijing 22 million Shanghai 17 million Moscow 15 million Tokyo 32 million London 12.9 million Los Angeles 15.2 million New York 19.7 million Cairo 14.5 million Osaka 17.4 million Karachi 11.8 million Seoul 20.6 million Mexico City 20.5 million Lagos 13.4 million Manila 16.3 million Kolkata (Calcutta) 15.1 million Rio de Janeiro 12 million Bangkok 12 million Mumbai (Bombay) 19.2 million São Paulo 18.9 million Jakarta 18.9 million Dhaka 13 million Buenos Aires 13.1 million Fig. 22-4, p. 589
Typical Daily Traffic Jam of People, Carts, and Other Vehicles in Delhi, India Fig. 22-5, p. 589
Case Study: Urbanization in the United States (1) • Four phases between 1800 and 2008 • Migration from rural areas to large central cities • ¾ of American population live in cities • Migration from large central cities to suburbs and smaller cities • ½ of American population live in suburbs • Migration from North and East to South and West • Migration from cities and suburbs to developed areas outside the suburbs = exurbs • Urbanization went from 5% to 79%
Case Study: Urbanization in the United States (2) • Environmental problems decreasing • Better working and housing • Better water and sanitation • Better health care • Older cities • Deteriorating services • Aging infrastructures • U.S. $2.2 trillion behind in infrastructure maintenance
Major Urban Areas in the United States Revealed by Satellite Images at Night Fig. 22-6, p. 590
Urban Sprawl Gobbles Up the Countryside (1) • Urban sprawl • Low-density development at edges of cities/towns • Contributing factors to urban sprawl in the U.S. • Ample land • Low-cost gasoline; highways • Tax laws encouraged home ownership • State and local zoning laws • Multiple political jurisdictions: poor urban planning
Urban Sprawl Gobbles Up the Countryside (2) • Megalopolis • Bowash: decrease amount of space between Boston, New York and Washington DC • Caused many environmental and economic problems • Driving needed • Decreased energy efficiency • Degraded land
Urban Sprawl in and around the U.S. City of Las Vegas, Nevada, from 1973 to 2000 Fig. 22-7, p. 591
Natural Capital Degradation: Urban Sprawl Fig. 22-8, p. 592
Natural Capital Degradation Urban Sprawl Land and Biodiversity Water Energy, Air, and Climate Economic Effects Loss of cropland Increased use and pollution of surface water and groundwater Increased energy use and waste Decline of downtown business districts Loss and fragmentation of forests, grasslands, wetlands, and wildlife habitat Increased emissions of carbon dioxide and other air pollutants More unemployment in central cities Increased runoff and flooding Fig. 22-8, p. 592
Urbanization Has Advantages (1) • Centers of: • Economic development • Innovation • Education • Technological advances • Jobs • Industry, commerce, transportation
Urbanization Has Advantages (2) • Urban residents tend to have • Longer lives • Lower infant mortality • Better medical care • Better social services • More recycling programs • Concentrating people in cities can help preserve biodiversity in rural areas
Urbanization Has Disadvantages (1) • Huge ecological footprints • Lack vegetation • Water problems • Concentrate pollution and health problems • Excessive noise • Altered climate and experience light pollution • Urban heat island • Light pollution • Turtles, bird migration patterns
Natural Capital Degradation: Urban Areas Rarely Are Sustainable Systems Fig. 22-9, p. 594
Inputs Outputs Energy Solid wastes Waste heat Food Air pollutants Water Water pollutants Raw materials Greenhouse gases Manufactured goods Manufactured goods Noise Money Wealth Information Ideas London Fig. 22-9, p. 594
Noise Levels of Some Common Sounds Fig. 22-10, p. 595
Permanent damage begins after 8-hour exposure 85 Noise Levels (in dbA) 0 10 20 30 40 50 60 70 80 90 100 110 120 130 140 150 Normal breathing Quiet rural area Rainfall Vacuum cleaner Lawn mower Rock music Earphones at loud level Boom cars Whisper Quiet room Normal conversation Average factory Chain saw Thunderclap (nearby) Air raidsiren Rifle Fig. 22-10, p. 595
Life Is a Desperate Struggle for the Urban Poor in Less-Developed Countries • Slums • Squatter settlements/shantytowns • Terrible living conditions • Lack basic water and sanitation • High levels of pollution • What can governments do to help? • Improve education, health care, family planning, encourage small town investments • Clean water & sanitation, transportation
Global Outlook: Extreme Poverty in Rio de Janeiro Slum Fig. 22-11, p. 596
Case Study: Mexico City • Urban area in crisis • Severe air pollution • Water pollution • 50% unemployment • Deafening noise • Overcrowding • Traffic congestion • Inadequate public transportation • 1/3 live in slums (barrios)or squatter settlements • What progress is being made? • Banned cars in central zone, pollution controls on cars • Unleaded gasoline • Added greenspace, waste processing centers
Photochemical Smog in Mexico City Fig. 22-12, p. 597
Cities Can Grow Outward or Upward • Compact cities • Hong Kong, China • Tokyo, Japan • Mass transit • Dispersed cities • U.S. and Canada • Car-centered cities
Motor Vehicles Have Advantages and Disadvantages (1) • Advantages • Mobility and convenience • Jobs in • Production and repair of vehicles • Supplying fuel • Building roads • Status symbol • Disadvantages • Accidents: 1.2 million per year, 15 million injured • Kill 50 million animals per year • Largest source of outdoor air pollution • Helped create urban sprawl • Traffic congestion
Los Angeles Freeways Fig. 22-13, p. 599
Reducing Automobile Use Is Not Easy, but It Can Be Done (1) • Full-cost pricing: high gasoline taxes • Educate consumers first • Use funds for mass transit • Opposition from car owners and industry • Lack of good public transit is a problem • Rapid mass transit • Difficult to pass in the United States • Strong public opposition • Dispersed nature of the U.S.
Reducing Automobile Use Is Not Easy, but It Can Be Done (2) • Raise parking fees • Tolls on roads, tunnels, and bridges into major cities • Charge a fee to drive into a major city • Car-sharing
Some Cities Are Promoting Alternatives to Car Ownership • Bicycles • Heavy-rail systems • Light-rail systems • Buses • Rapid-rail system between urban areas
Trade-Offs: Bicycles Fig. 22-14, p. 601
Trade-Offs Bicycles Advantages Disadvantages Are quiet and non-polluting Provide little protection in an accident Take few resources to make Provide no protection from bad weather Burn no fossil fuels Are impractical for long trips Require little parking space Secure bike parking not yet widespread Fig. 22-14, p. 601
Trade-Offs: Mass Transit Rail Fig. 22-15, p. 601
Trade-Offs Mass Transit Rail Advantages Disadvantages Uses less energy and produces less air pollution than cars do Expensive to build and maintain Cost-effective only along a densely populated corridor Use less land than roads and parking lots use Causes fewer injuries and deaths than cars Commits riders to transportation schedules Fig. 22-15, p. 601
Trade-Offs: Buses Fig. 22-16, p. 601
Trade-Offs Buses Advantages Disadvantages Reduce car use and air pollution Can lose money because they require affordable fares Can get caught in traffic and add to noise and pollution Can be rerouted as needed Commit riders to transportation schedules Cheaper than heavy-rail system Fig. 22-16, p. 601
Trade-Offs: Rapid Rail Fig. 22-17, p. 602
Trade-Offs Rapid Rail Advantages Disadvantages Much more energy efficient per rider than cars and planes are Costly to run and maintain Causes noise and vibration for nearby residents Less air pollution than cars and planes Can reduce need for air travel, cars, roads, and parking areas Adds some risk of collision at car crossings Fig. 22-17, p. 602
Potential Routes for High-Speed Bullet Trains in the U.S. and Parts of Canada Fig. 22-18, p. 602
Conventional Land-Use Planning • Land-use planning • Encourages future population growth • Encourages economic development • Revenues: property taxes • 90% of local government revenue in the U.S. • Environmental and social consequences • Zoning • Problems and potential benefits • Mixed-use zoning
Smart Growth Works (1) • Smart growth • Reduces dependence on cars • Controls and directs sprawl • Cuts wasteful resource • Uses zoning laws to channel growth
Solutions: Smart Growth Tools Fig. 22-19, p. 604