Download
1 / 12
120 likes | 267 Vues
Illustrating the HIV Care Continuum in U.S. Cities. Washington, DC. About. Effective treatment requires successful HIV diagnosis as well as linkage and retention in HIV care - this is the HIV care continuum.

E N D
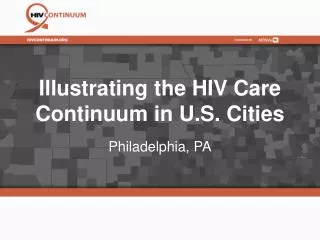
Illustrating the HIV Care Continuum in U.S. Cities Washington, DC
About Effective treatment requires successful HIV diagnosis as well as linkage and retention in HIV care - this is the HIV care continuum. To be the most impactful, public health strategies that address gaps in the HIV care continuum will require detailed information on disproportionately impacted populations. HIVContinuum.org is a compilation of interactive, online maps that allows users to connect with complex information about the HIV care continuum in several highly impacted cities in the U.S. HIVContinuum.org is powered by AIDSVu and uses public health surveillance data to increase understanding of the HIV treatment cascade by visualizing the impact of HIV on specific demographic groups, neighborhoods and zip codes.
Interactive Maps Maps at the Neighborhood or Ward Level New HIV Diagnoses Late HIV Diagnoses Linkage to HIV Care Engagement in HIV Care HIV Viral Suppression
Supporting the National HIV/AIDS Strategy • Prevent new HIV infections • Improve care and treatment • Reduce HIV-related health disparities HIVContinuum provides a new way to identify places where we can improve HIV testing, care and treatment.
Five-Year Risk of New HIV Diagnosis, by Ward, Washington DC, 2006-2010 Five-year risk of new HIV diagnosis, 2006-2010 (per 100,000 population of adults/adolescents in 2010) 0-582 583-875 876-963 964-1031 1032+ Not Shown* * Gray areas denote where data are not shown to protect privacy because of a small number of cases and/or a small population size. Notes: Data represent persons newly diagnosed with HIV in Washington, DC 2006-2010 and who were reported as of 12/31/12. Data Source: District of Columbia Department of Health, HIV/AIDS, Hepatitis, STD and TB Administration.
Proportion of Those Newly Diagnosed with HIV Late in the Course of HIV Infection, by Ward, Washington DC, 2006-2010 Proportion of adults/adolescents newly diagnosed with HIV from 2006-2010 with an AIDS diagnosis within 12 months of HIV diagnosis 0-10 % 11-20 % 21-30 % 31-50 % >50 % Not Shown* * Gray areas denote where data are not shown to protect privacy because of a small number of cases and/or a small population size. Notes: Data represent persons newly diagnosed with HIV in Washington, DC 2006-2010 and who were reported as of 12/31/12. Late HIV diagnosis was defined as immunologic or clinical AIDS (new CDC classification as A3, B3, or C1-C3) within 12 months of initial HIV diagnosis. Data Source: District of Columbia Department of Health, HIV/AIDS, Hepatitis, STD and TB Administration.
Proportion of Those Newly Diagnosed with HIV 2006-2010 Who were Linked to HIV Care, by Ward, Washington DC Proportion of adults/adolescents newly diagnosed with HIV from 2006-2010 with a reported CD4/viral load within 3 months of HIV diagnosis 90-100 % 80-89 % 70-79 % 50-69 % <50 % Not Shown* * Gray areas denote where data are not shown to protect privacy because of a small number of cases and/or a small population size. Notes: Data represent persons newly diagnosed with HIV in Washington, DC 2006-2010 and who were reported as of 12/31/12.Linkage to HIV care is defined as a report of a CD4 count or HIV viral load test within 3 months of initial HIV diagnosis. Data Source: District of Columbia Department of Health, HIV/AIDS, Hepatitis, STD and TB Administration.
HIV Viral Load Suppression in 2011 Among Those Newly Diagnosed 2006-2010 and Who Were Engaged in Care, by Ward, Washington DC Proportion of adults/adolescents newly diagnosed with HIV from 2006-2010 and engaged in HIV care in 2011 with a suppressed HIV viral load in 2011 90-100 % 80-89 % 70-79 % 50-69 % <50 % Not Shown* * Gray areas denote where data are not shown to protect privacy because of a small number of cases and/or a small population size. Notes: Data represent persons newly diagnosed with HIV in Washington, DC 2006-2010 and who were reported as of 12/31/12.Engaged in care for this indicator is defined as a report of an HIV viral load test. HIV viral load suppression is defined as the most recent viral load < 200 copies/ml. Data Source: District of Columbia Department of Health, HIV/AIDS, Hepatitis, STD and TB Administration.
HIV Viral Load Suppression in 2011 Among Those Newly Diagnosed 2006-2010, by Ward, Washington DC Proportion of adults/adolescents newly diagnosed with HIV from 2006-2010 with a suppressed HIV viral load in 2011 80-100 % 70-79 % 50-69 % 30-49 % <30 % Not Shown* * Gray areas denote where data are not shown to protect privacy because of a small number of cases and/or a small population size. Notes: Data represent persons newly diagnosed with HIV in Washington, DC 2006-2010 and who were reported as of 12/31/12.HIV viral load suppression is defined as the most recent viral load < 200 copies/ml. Data Source: District of Columbia Department of Health, HIV/AIDS, Hepatitis, STD and TB Administration.
The HIV Care Continuum Among Those Newly Diagnosed with HIV, by Demographic Groups, Washington DC, 2006-2010 Note: The color within each box corresponds to the most frequent category of the outcome at the Ward level for each sub-group. The categories for new HIV diagnoses were created from the overall data, therefore no mode exists (gray box). 1 New HIV diagnoses 2006-2010 per 100,000 persons 2 Proportion with AIDS within 12 months of diagnosis 3 Proportion with a CD4 or viral load within 3 months of diagnosis 4 Proportion with a CD4 or viral load in 2011 5 Proportion with suppressed HIV viral load in 2011 Data Source: District of Columbia Department of Health, HIV/AIDS, Hepatitis, STD and TB Administration.
Map Details • Data on HIVContinuum may differ from data released in local HIV surveillance reports. • The HIVContinuum maps do not reflect undiagnosed cases. • As is standard in the display of health statistics, data generated from a numerator less than 12 are considered unstable and should be interpreted with caution– this situation occurs frequently with HIV care continuum mapping at this level of detail. • The case definitions and data systems for new HIV diagnoses and late HIV diagnoses are standard in HIV case surveillance, but standardization for the other indicators used here is still a work-in-progress.
Contact Information More map views are available at HIVContinuum.org For more information about HIVContinuum, including information about custom map views and images, please email info@hivcontinuum.org Connect With Us HIV CareContinuum @HIVContinuum HIV Care Continuum