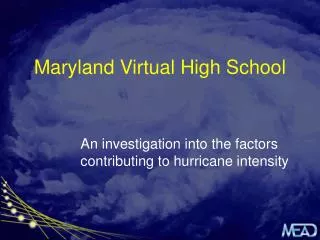
Maryland Virtual High School
Maryland Virtual High School An investigation into the factors contributing to hurricane intensity Hurricane Tracking STELLA Model Model based on Data from 1996-98 Coriolis effect Parameters Initial heading A turning day Final heading Factors influencing hurricane wind strength


Maryland Virtual High School
E N D
Presentation Transcript
Maryland Virtual High School An investigation into the factors contributing to hurricane intensity
Model based on Data from 1996-98 Coriolis effect Parameters Initial heading A turning day Final heading Factors influencing hurricane wind strength Sea surface temperature Randomness Adapted by Mary Ellen Verona from the model developed by the Glynns Integration of Systems Thinking Project Model Characteristics
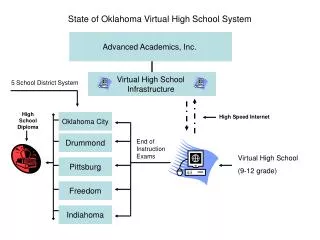
Classroom Implementation • High School Earth Science • 2003-04 school year • Hurricane Intensity Inquiry • Role of sea surface temperature • Role of location of landfall region • Role of uncertainty • Jigsaw Methods • Science Standards • Student Assessment
Jigsaw 1 • Divide class into 9 groups of 3 students each • Aug, Sept, Oct of 1996, 1997, 1998 • Assign each group a unique starting date for the simulated hurricane • Give each group member the corresponding SST contour map • Assign each group the same random seed and landfall code • Run the simulation and record the hurricane’s wind speed and category at landfall
Jigsaw 2 • Regroup the students into 9 groups to investigate hurricane intensity and these factors • The month in which the hurricane starts • Grouped by year • The year in which the hurricane starts • Grouped by month • Random factors and landfall location • Grouped by year
Jigsaw 3 • Regroup the students into 3 groups consisting of one person from each of the 9 groups in Jigsaw 1 • Direct the group members to share their findings from Jigsaw 2 • Ask them to draw conclusions about the influence of sea surface temperature, landfall location, and uncertainty on hurricane intensity • Have each group report to the class their conclusions
Standards • Maryland Standards (http://mdk12.org/mspp/standards/science/) • Earth Science Content • The student will describe current efforts and technologies used to study the atmosphere, land, and oceans of Earth (remote sensing from space, undersea exploration, seismology, weather data collection).(CLG 2.1.1) • Science Processes • The student will formulate a working hypothesis.(CLG 1.2.3) • The student will test a working hypothesis.(CLG 1.2.4) • The student will analyze data to make predictions, decisions, or form conclusions.(CLG 1.4.2)
Student Assessment • Formative and Summative Assessments • Pre-tests • Checking for understanding • Teacher scaffolding and student self-regulation of learning • Post-tests