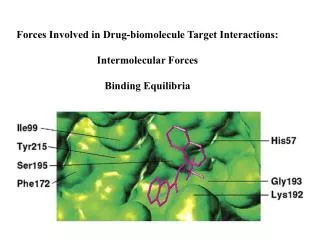
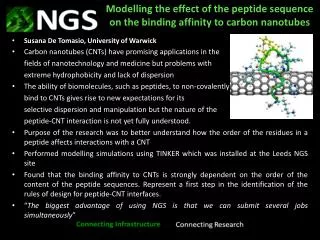
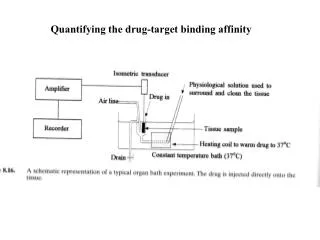
Quantifying the drug-target binding affinity
Quantifying the drug-target binding affinity. Receptors as targets (Receptors are 45% of current drug targets). Receptors are areas of proteins found in cellular membranes or nuclei They are classified by their function (superfamilies)

Quantifying the drug-target binding affinity
E N D
Presentation Transcript
Receptors as targets (Receptors are 45% of current drug targets) • Receptors are areas of proteins found in cellular membranes or nuclei • They are classified by their function (superfamilies) • Any natural (or unnatural) chemical that binds is a ligand (Natural: neurotransmitters, hormones, growth factors, insulin, some vitamins)
Observed responses: effect of addition of an agonist or antagonist Dose-response or concentration-response curve: plot of response (y axis) vs. -log[ligand](semilogarithmic plots): Agonist Antagonist
Observed responses: Types of antagonists How do different antagonists affect the activity of a ligand (agonist)? Ex.: ACh = Acetylcholine = ligand (agonist) • ACh+Competitive antagonist Y: • Effect of Y is reversed by addition of more ligand • ACh+Noncompetitive antagonist Y’: • Effect of Y’is unaffected by [ligand]
Observed responses: Some definitions • EC50 is the molar concentration that produces half the maximum biological response observed. This is often used to estimate the value of KD, but the correlation is not always reliable. • ED50 is the dose administered that produces half the maximum biological response observed. • IC50 is the concentration at which an antagonist exerts its half-maximal effect.
Theories of Drug-receptor interactions Can they explain the observations? (Receptors are 45% of current drug targets) Occupancy theory: intensity of the pharmacological effect is directly proportional to the number of receptors occupied by the drug (fraction bound, or fMbound). A = drug; M = receptor
Occupancy Theory: Types of antagonists - one receptor May bind in the ligand binding site OR nearby, partially blocking it May bind at allosteric site, altering ligand binding site
Theories of Drug-receptor interactions Additional known expressions (besides fMbound) can be used to generate a different equation for fraction bound: Use mass balance and K to generate the following: Substitute this into the expression for fraction bound:
Theories of Drug-receptor interactions Plot fraction bound versus [A]: direct or saturation plot
Theories of Drug-receptor interactions Data may be displayed in a semi-logarithmic plot as well.
Theories of Drug-receptor interactions While the occupancy theory simulates actual dose-response curves, (theoretically, KD = EC50), it does not account for agonists that do not produce the maximum effect. Modified occupancy theory: modified to separate the binding affinity from the intrinsic activity () of the compound. That is, a compound can bind tightly, but cause a little or no effect.
Theories of Drug-receptor interactions The modified occupancy theory is also incomplete: How can two molecules binding to one receptor cause different effects? (one as an agonist; on as an antagonist) How can desensitization be explained? • Rate theory: stimulus occurs only when the ligand first occupies the receptor. • Induced fit theory: a specific conformational change in a receptor is responsible for initiation of the biological response. • Agonist binding induces this conformational change. • Partial agonist induces a partial conformational change. • Antagonist binding would either not cause a conformational change OR it would cause a conformational change without eliciting a biological response.
Determination of affinity constants K. • Simply measure the equilibrium concentrations of each of the species involved, (A, M, AM), and plug in the Kd expression. • It is generally difficult to directly measure these concentrations. • Many alternative methods have been developed to measure ligand binding strength. 1. Determination of concentration of unbound [ligand] using phase separation (equilibrium dialysis; ultrafiltration)
Determination of affinity constants K. 2. Add one component to the other in successively larger amounts, with the concurrent measurement of some observable (titration). The observable (often spectral) change is from either the ligand OR the macromolecule. Observed data is fit to a binding model that incorporates the spectroscopic observables. Best fit of data to model reveals K.
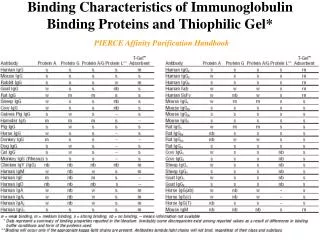
Determination of affinity constants K. • 3. Competetive binding assays • a. Quantitative affinity chromatography. • b. Biosensor technology (BIAcore or IASys). Quantitation of bound ligand by mass. • Radioligand binding assay. Step1. Determine binding constant (Kd) of ligand Step2. Determine binding constant of drugs by competition
Determination of K - Radioligand competition binding assays • Step 1: Determine binding constant Kd of ligand (radiolabeled) with receptor • Incubate different ratios of [radiolabeled ligand] and [receptor]; equilibrate; separate receptor-bound ligand from unbound ligand; determine [ ]bound using scintillation counting. • Correct for nonspecific binding of radioligand to other substances
Determination of K - Radioligand competition binding assays Step 1(cont): Correction for nonspecific binding (example):
Determination of K - Radioligand competition binding assays Step 1: Determination of radioligand KD: Rearrange our equations… • Plot corrected [AM] versus [A] (direct plot). Evidence of saturation of receptor must be shown. • Analyze data using nonlinear regression. (Minimizes the sum of squares of deviations from fit and iteratively tries may solutions to get the best fit of [M]0 and KD to the experimental data). Usually linear transformations (Scatchard) of data are shown in publications, even if nonlinear regression analysis was used.
Determination of K - Radioligand competition binding assays Step 1: Determination of radioligand KD: plots (example) Scatchard:
Determination of K - Radioligand competition binding assays • Step 2: Competition Studies: Determine KI (drug). Fix the concentration of receptor and radioligand, while varying the concentration of the test compound (drug). • This results in a decrease of radioligand (L1) binding with increasing [drug] (L2). • the observed IC50 will depend on the amounts of radioligand and drug as well as KD (ligand) and KI (drug).
Determination of K - Radioligand competition binding assays • KI can be determined mathematically (Cheng and Prusoff, 1973). KI (drug) = KL2 KD (ligand) = KL1 [Radioligand]
References for quantification of binding: Ninfa A. J.; Ballou, D. P. Fundamental Laboratory Approaches for Biochemistry and Biotechnology; Fitzgerald Science Press: Bethesda, MD, 1998. Patrick, G. L. An Introduction to Medicinal Chemistry; Oxford University Press: New York, NY, 2001 Silverman, R. B. The Organic Chemistry of Drug Design and Drug Action ; Academic Press: San Diego, CA, 1992. Thomas, G. Medicinal Chemistry An Introduction; John Wiley and Sons, Ltd.: New York, NY, 2000.
Example problems Biochemistry,41 (32), 2002, 10262-10269. Trp F3Trp Dose-response curves for the application of 5-hydroxytryptamine (5HT, a ligand) to nAchR variants (receptor mutants). Each receptor variant has a binding site residue with 0, 1, 2, or 3 fluorines on a key tryptophan residue. What is the EC50 of 5HT to each variant 1-4 (labeled curves from left to right)? Which variant binds to 5HT most strongly? 5HT has the following structure. Can you explain the observed EC50’s?
J Med Chem 45 (15) 2002 p. 3234 Nicotinic acetylcholine receptor agonists: a3b4 receptor Using KI (table 1), rank agonists 1, 2, and 3 from best to worst for binding the a3b4 receptor. Does the functional assay (right) reflect this ranking?
J. Med. Chem.,46 (7), 1153 -1164, 2003 • All these compounds have been tested as influenza endonuclease (enzyme) inhibitors. • Compare the IC50’s of compounds 9-12. Which is the best inhibitor? • This data (for 9-12) reveals that a structural feature is important for inhibition. What is it? • The IC50 vs. pH graph for compound 8 is shown to the right. What is the optimal pH for inhibition? • All of these inhibitors are thought to bind to a metal ion in the enzyme active site. How might the IC50 vs. pH graph support this?