Download
1 / 36
360 likes | 373 Vues
Gain insights on top trends in U.S. online retail, consumer behaviors, and key government and health sites. Explore data from comScore's global panel of 2 million internet users.

E N D
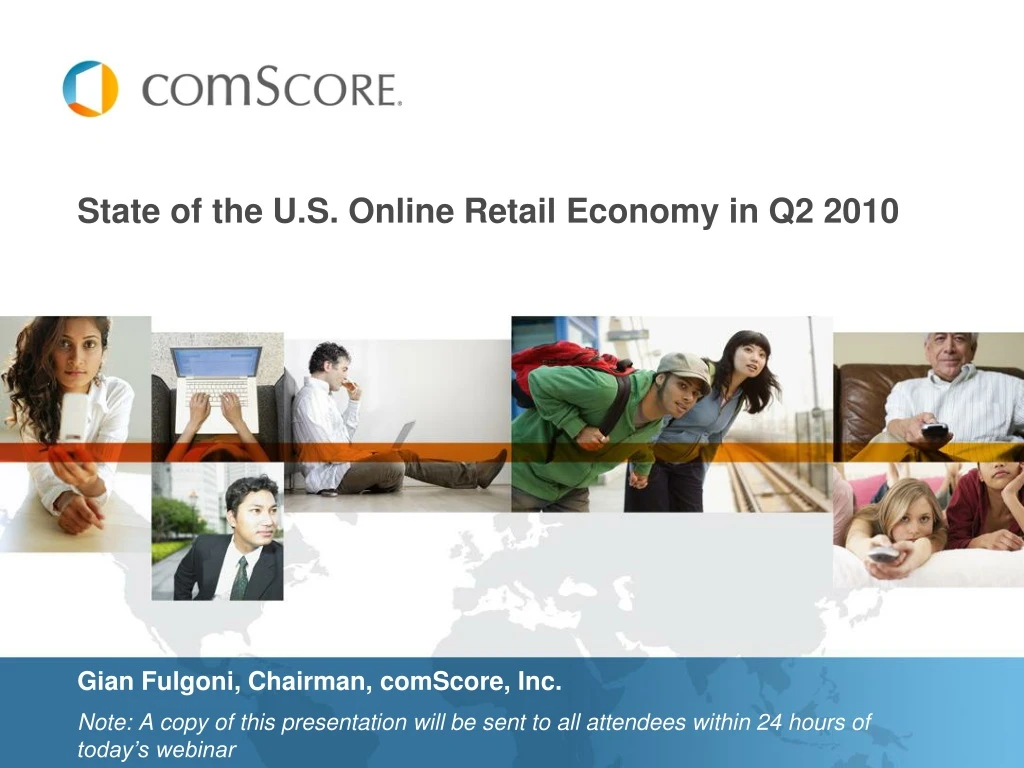
State of the U.S. Online Retail Economy in Q2 2010 Gian Fulgoni, Chairman, comScore, Inc. Note: A copy of this presentation will be sent to all attendees within 24 hours of today’s webinar
Agenda • comScore background • A Day in the Life of a Digital Consumer • Key Online Trends: • - Top Government Sites • - Health Sites • - eCommerce & Online Travel • - Who is today’s online buyer? • - The role of pricing and promotion on the online experience
Broad Client Base and Deep Expertise Across Key Industries Media Agencies Telecom/Mobile Financial Retail Travel CPG Pharma Technology
The Trusted Source for Digital Intelligence Across Vertical Markets 9out of the top10 INVESTMENT BANKS 4out of the top4 WIRELESS CARRIERS 9out of the top10 INTERNET SERVICE PROVIDERS 47 out of the top 50 ONLINE PROPERTIES 9out of the top10 PHARMACEUTICAL COMPANIES 9out of the top10 CPG COMPANIES 42out of the top50 ADVERTISING AGENCIES 9out of the top10 CONSUMER FINANCE COMPANIES 9 out of the top10 U.S. MEDIA 9 out of the top10 AUTO INSURERS
Data sourced from comScore’s global panel of 2 million Internet users Analysis Parameters 360°View of Consumer Behavior E-commerce data includes all worldwide buying on U.S. sites Unless explicitly stated otherwise, the term e-commerce refers to online retail spending, which excludes travel, autos and auctions; online travel purchases reported separately Behavioral activity through July 2010 Consumer Measurements: Site Visitation Online Buying Video Viewing Attitudes and Intentions Behavioral Segments Retailer Views: Large vs. Small Retailers Multi-Channel vs. Pure-Play Retailers
The average internet user in the US spends just over an hour a day online • In a typical month the average US internet user: • Spends 32.6 hours online • This is an 11% increase year over year. • Goes online 74 times during the month • Consumes more than 2,700 pages of content • The internet has enabled a number of behaviors that change the way people shop, play, transact, and consume information. • Social Networking: • Facebook is now the #1 site in the US in terms of page views and #4 in total audience • Facebook alone now accounts for 7.5% of a person’s time spent online. • Twitter’s US audience has grown 140% vs. year ago to 22 million visitors and it now ranks among the top 50 US web properties Source: comScore April 2010
Government and Health through the lens of the digital consumer
A Snapshot of The Department of Commerce In August 2010: There were 8,096,000 unique visitors to Department of Commerce sites These sites claimed a 3.8% reach of the total U.S. online population Visitors spent an average of 3.4 minutes per visit on these sites On average, these sites received 824,000 daily visitors The average visits per visitor was 4.8 Of the Top 5 search terms bringing visitors to the Department of Commerce, 4 of them were related to weather NOAA, the National Oceanic and Atmospheric Administration, appeared in the top second and third search terms Source: comScore Media Metrix, July 2010
Nearly 4% of the U.S online population visited a Department of Commerce website in August 2010 • The Department of Commerce is ranked third among government sites, with Department of Education and National Institutes of Health ahead of it. Top 10 most visited government sites Source: comScore Media Metrix, August 2010
A vast majority of the traffic to the Department of Commerce is driven by weather-related sites such as NOAA.GOV and WEATHER.GOV Source: comScore Media Metrix, August 2010
NOAA – comScore Dashboard Unique Visitors to NOAA tends to peak during months of severe weather conditions such as winter snow storms and summer hurricanes. Visitors to NOAA are more than eight times more likely than the average internet user to visit intellicast.com, a local and national weather site
Visitation, Trends, Demographic Composition, Search Terms, and Cross-Visitation in a Snapshot The terms “US Passport” and “Passport” are two of the most common search terms that lead to State.gov. Visitors come from all over the world, with nearly 40% coming from countries outside of the U.S. Source: comScore Media Metrix Dashboard July 2010
56% of the U.S online population visited a health website in July 2010 • Many of the top 10 most visited health sites are off of major portals such as Yahoo, MSN and CNN. • Everyday Health includes popular sites such as MayoClinic.com and Drugstore.com. Top 10 most visited health sites Source: comScore Media Metrix Key Reports July 2010
In the first three months after the H1N1 outbreak, more searchers clicked through to Wikipedia than CDC Clorox received more clicks than the NIH
Following a soft 2009, total e-commerce sales through Q2 2010 were up 7% versus year ago. Travel and non-travel up 5% and 9%, respectively. e-Commerce Dollar Sales Growth ($ Billions)Source: comScore e-Commerce Measurement +7% +7% -2% +17% $214 $209 +19% $200 +22% $171 +26% +9% -5% $143 +12% +29% +13% $117 $111 +20% $93 +28% $72 +5% +33% 0% +6% +20% +24% Travel +24% +26% +9% Non-Travel +26% YTD 2010
Validation of comScore Sales Data:Comparison of comScore data to U.S. Department of Commerce Quarterly U.S. e-Commerce Sales* ($ Billions) Source: comScore & U.S. Department of Commerce (DOC) Quarterly U.S. e-Commerce Growth* vs. YA Source: comScore & U.S. Department of Commerce (DOC) comScore Estimate of DOC comScore Estimate of DOC Dept. of Commerce (DOC) Dept. of Commerce (DOC) Correlation: 0.96 Billions ($) % Growth vs. YA *Note: To be consistent with DOC, comScore estimate excludes travel and event tickets but includes auction fees and autos.
After two quarters of accelerating sales, e-commerce growth plateaued in Q2 Quarterly e-Commerce Sales Growth vs. YA Source: comScore e-Commerce Measurement 23% 23% 19% 17% 13% 11% 10% 9% 6% 3% 0% -2% -3% -1% Quarterly Retail & Food Services Sales Growth* vs. YA Source: U.S. Department of Commerce (DOC) When excluding autos, gas and food/beverage, Q2 retail sales were marginally softer at +6% 7% 6% 5% 4% 4% 4% 3% 2% 2% 1% -7% -8% -9% -10% *Note: The U.S. Department of Commerce calculation includes total retail and food service sales, which also includes motor vehicles and parts dealers.
e-Commerce continues to gain share of retail spending on an apples-to-apples basis e-Commerce Share of Corresponding Retail Spending* Source: comScore for e-Commerce & U.S. Department of Commerce (DOC) for Retail e-CommerceShare e-Commerce share peaks in colder seasons (Q4 & Q1) *Note: e-Commerce share is shown as a percent of DOC’s Total Retail Sales excluding Food Service & Drinking, Food & Bev. Stores, Motor Vehicles & Parts, Gasoline Stations and Health & Personal Care Stores.
Most product categories showed sales growth versus year ago. Consumer electronics and computers have shown strength throughout 2010 Q2 2010 e-Commerce Sales Growth vs. YA by Retail Category Source: comScore e-Commerce Measurement Out-Performing Total Internet(Growth rates of 9% or higher) Under-Performing Total Internet(Growth rates of 1%-8%) Flat/Negative Growth
Online Travel: Site visitation activity suggests an upward trend Interest trending upward
Lower-and-upper income segments are drivers of online growth in Q2 2010, but the large mid-income segment shows no growth e-Commerce Sales vs. YA by Income Segment Source: comScore e-Commerce Measurement Contribution of Total e-Commerce Growth for Q2 ‘10 Bracket Share of Spending in Q2 ‘10 Income Segment Online Retail Spending Online Retail Spending Growth in Q2 ‘10 vs. Q2 ‘08 Growth in Q2 ‘10 vs. YA Online Retail Under $50,000 Income Segment +14% +22% 22% +5% Online Retail Spending $50,000 - $99,999 -8% -2% 41% -1% $100,000 or more +28% +17% 37% +6% +8% +9% Total 100% +9%
The average heavy online (non-travel) buyer spent $615 in Q2 2010, nearly 5X more than medium buyers and 20X more than light buyers Key Shopping Metrics for Heavy/Medium/Light Buyer in Q2 2010 Source: comScore e-Commerce Measurement Amazon Attracts a Higher Proportion of Heavy Online Buyers Amazon reaches a third of heavy online buyers, up 3 percentage points from Q1 2010 H/M/L Definition:Heavy = Top 20% of buyers based on dollars spent in Q2 2010Medium = Next 30% of buyers based on dollars spent in Q2 2010Light = Bottom 50% of buyers based on dollars spent in Q2 2010
Women are more avid online buyers than men, making up 58% of total dollars spent and 61% of online transactions In the U.S., 12.5% of women Internet users made an online purchase in February 2010, compared to 9.3% of men. WomenMen Dollars Transactions U.S. Consumers, Non-Travel Internet Purchases, February 2010Source: comScore e-Commerce Report
The Impact of Promotions & Price Incentives on Online Shopping Behavior
Comparison Shopping sites, such as Nextag and Shopping.com, have gained visitors and increased time spent on their sites 85.5 Million +30% vs. Jul ‘08 440 Million +51% vs. Jul ‘08
Coupon sites continue to grow in importance; category visitors tend to skew slightly older and female 101.1 million visits +56% vs. Jul ‘08 34.5 million UVs +34% vs. Jul ‘08 UV Composition Index by Age UV Composition Index by Gender 95 114 123 135 86 130
Coupons.com, which leads the Coupon category in terms of UVs, reports $1 billion in redemption value in first half of 2010 “[Coupons.com] said savings from coupons printed out or loaded to a loyalty card from its online properties doubled to more than $1 billion from $529 million a year ago. The value of savings in June alone hit $110 million, the highest total to date for any single month via Coupons.com.” (MediaPost, July 2010) With only 2.2 million UVs, MyPoints Sites generated 14.5 million visits or an average of 6.6 visits per visitor in July 2010. *Note: LivingSocial is currently included in the Social Networking category within comScore Media Metrix. For the purpose of this analysis, it has been included in the above Coupon ranking.
Flash Sale sites continue to gain traction with high growth rates versus year ago, although we’re seeing a slight slowdown during the summer months U.S. Unique Visitors to Flash Sale Sites Source: comScore Media Metrix HauteLook+12% vs. July ‘09 Ideeli +382% vs. July ‘09 Gilt+46% vs. July ‘09 RueLaLa+15% vs. July ‘09
Please contact us at learnmore@comscore.com if you have any additional questions or comments. QUESTIONS?
Thank You! • Want more insights? Follow us on Twitter! • http://twitter.com/linda_abraham • http://twitter.com/comscore