n -Hexane
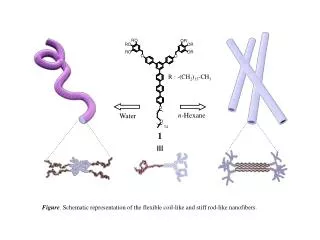
R : -(CH 2 ) 13 -CH 3. n -Hexane. Water. 1. Figure . Schematic representation of the flexible coil-like and stiff rod-like nanofibers. (a). (b). g (2) (t)-1. g (2) (t)-1. R H (nm). R H (nm). Lag time (ms). Lag time (ms). (c). (d). D app ×10 7 (cm 2 s -1 ). I q 2. q (nm -1 ).

n -Hexane
E N D
Presentation Transcript
R : -(CH2)13-CH3 n-Hexane Water 1 Figure. Schematic representation of the flexible coil-like and stiff rod-like nanofibers.
(a) (b) g(2)(t)-1 g(2)(t)-1 RH (nm) RH (nm) Lag time (ms) Lag time (ms) (c) (d) Dapp×107 (cm2s-1) Iq2 q (nm-1) q2×10-10 (cm2) Figure. Autocorrelation functions of 1 (scattering angular range of 45-135°), and inset is size distribution of the aggregates at a scattering angle of 90° (from CONTIN analysis) (a) in water, (b) in n-hexane, (c) Angular dependence of the apparent diffusion coefficient for 1 and (d) Kratky plots in aqueous solution (○), in n-hexane solution (●).
(a) (b) 50 nm 50 nm (c) (d) 15.5 nm 13.6 nm-1 16.5 nm-1 intensity intensity q (nm-1) q (nm-1) Figure. TEM images of the nanofibers of 1 (a) in aqeous solution, (b) in n-hexane solution and (c) SAXS pattern of molecule 1 formed from nhexane solution and inset is a representative optical polarized micrograph of the nematic phase, (d) WAXS pattern of the dried liquid crystal gel formed from n-hexane solution.