Sampling Demystified: Sample Size and Errors
Learn how sample size impacts research reliability. Explore the importance of random sampling and the concept of confidence levels. Discover how statisticians estimate distributions for accurate results.

Sampling Demystified: Sample Size and Errors
E N D
Presentation Transcript
Sampling Demystified: Sample Size and Errors Research Methods for Public Administrators Dr. Gail Johnson Dr. G. Johnson, www.ResearchDemsytified.org
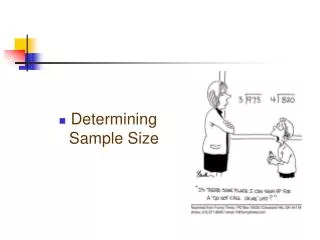
Samples: How Many? • When working with non-random samples, size is not that important because researchers know that they can not generalize to the larger population • Face validity is sufficient Dr. G. Johnson, www.ResearchDemsytified.org
Sample: How Many? • When working with random sample data, size matters • Researchers want a big enough sample so they can be reasonably confident that the results are a fairly accurate reflection of the population • Statisticians have figured this out. Dr. G. Johnson, www.ResearchDemsytified.org
Random Sample Size • Sample size is a function of three things: • Size of the population of interest • Decision about how important is it to be accurate? • Confidence level • Decision about how important is to be precise? • Sampling error (also called margin of error) or confidence interval • In general, accuracy and precision is improved by increasing the sample size Dr. G. Johnson, www.ResearchDemsytified.org
Sample Size • Based on probability theory and the concept of normal distributions • Statisticians have figured this all out • I believe, I believe!! • We will focus on the concepts and application Dr. G. Johnson, www.ResearchDemsytified.org
Random Samples is Based on Probabilities • If we selected 1,000 random samples, the results for average height would theoretically form a bell-shaped curve (normal curve) • This means that 95% of the samples would show an average height that was plus or minus 2 standard deviations. • This statistical magic allows statisticians to estimate the probability of getting results from a random sample that are outside of that 95% Dr. G. Johnson, www.ResearchDemsytified.org
Bell-Shaped Curve(Normal Curve) http://commons.wikimedia.org/wiki/File:Standard_deviation_diagram.svg, Jeremy Kemp, on 2005-02-09 Dr. G. Johnson, www.ResearchDemsytified.org
Normal Curve Explained • This is called a normal distribution. • If we were to line up 1,000 people on the soccer field according to their height, they would look like a bell. • At the center, is the average or mean. The highest number of people would be of average height. • To the right side, would be the number of people who were taller than the average height, and to the left would be the people shorter than the average height. Dr. G. Johnson, www.ResearchDemsytified.org
Normal Curve Explained • The properties of the normal distribution are that 68% are within a set distance from the mean (one standard deviation) and 95 percent are within two standard deviations from the mean. • For our purposes here, we just need to takeaway the point that statisticians have figured out how to estimate how 95% of a given population is likely to be distributed. • They can estimate the height of 95% of the people standing out on the soccer field. Dr. G. Johnson, www.ResearchDemsytified.org
Statistical Magic • This ability to estimate distributions allows statisticians to provide researchers with a level of confidence about results from a random sample. Dr. G. Johnson, www.ResearchDemsytified.org
What Does Confidence Mean? • How confident do you want to be that the sample result is reasonably accurate? • The standard is a 95% confidence level: • This means that 19 out of 20 random samples would have found similar results that we found from this random sample • Or that we are 95% certain that the sample results are a reasonably accurate estimate of the population Dr. G. Johnson, www.ResearchDemsytified.org
What Does Precision Mean? • Sampling Error in survey results is one way to estimate precision: • The social science standard is plus and minus 5%. • We obtained these survey results: • 45% oppose building a dam and 55% favor building a dam. • The margin of error is +/- 5%. Dr. G. Johnson, www.ResearchDemsytified.org
Margin of Error • A way of expressing the sampling error in a survey’s results • The larger the margin of error, the less faith one should have that the poll's reported results are close to the "true" figures; that is, the figures for the whole population Dr. G. Johnson, www.ResearchDemsytified.org
Margin of Error • If the margin of error overlaps, it means the results are too close to call for the population as whole • Think of election polls: if the survey results say 52% favor and 48% favor Y, with a +/-5% margin of error, the race is too close to call. It is just as probably that 48% favor X and 52% favor Y Dr. G. Johnson, www.ResearchDemsytified.org
Confidence Interval: Another Way to Estimate Precision. • It is used when working with real numbers (ie. Interval or ratio level data such as age or salary). • The average salary of the respondents is $20,000, and the confidence interval is $18,000--$22,000. • Conclusion: we are 95% confident that the true average salary of the population is between $18,000 and $22,000. • Put another way, we are 95% confident that if had surveyed everyone, the average salary would be between $18,000 and $22,000. Dr. G. Johnson, www.ResearchDemsytified.org
Population and Sample Size Assuming we wanted to be 95% confident with a margin of error of plus/minus 5%: Population sizeSample size 10 10 50 44 100 80 200 132 500 217 1,000 278 3,000 341 100,000+ 385 Source: Krejcie and Morgan, 1970. Determining Sample Size for Research Activities, Educational and Psychological Measurement 30: 607-610 Dr. G. Johnson, www.ResearchDemsytified.org Dr. G. Johnson 16
Random Sample Sizes • Note: sample sizes in the tables are proportionately larger when the population size is small. • If the population is 100, then the sample size would be 80. • If the population is 1,000, the sample size would be 278. • This sample sizes in this table were based on the social science standard of 95% confidence level, with +/- 5% sampling error. Dr. G. Johnson, www.ResearchDemsytified.org
Sample Size • In general, sample accuracy and precision is improved by increasing the sample size. • Assuming a large population of 100,000 or more, that sample size would be 385 if we wanted to be 95% certain with a +/-5% margin of error. • The sample size would be 1,067 if we wanted to be 95% certain and only +/-3% margin of error. Dr. G. Johnson, www.ResearchDemsytified.org
Sample Sizes: Relationship between Precision and Confidence Level PrecisionConfidence Level 99% 95% 90% 1% 16,576 9,604 6,765 2% 4,144 2,301 1,691 3% 1,848 1,067 752 5% 883 385 271 These are for populations over 100,000 Dr. G. Johnson, www.ResearchDemsytified.org
Another View of Sample Error http://en.wikipedia.org/wiki/Margin_of_error Dr. G. Johnson, www.ResearchDemsytified.org 20
Random Samples Are Imperfect • Random samples always have a probability of error. • Statisticians have figured out how to estimate that probability. • Random sample data and inferential statistics go together • Statistics: estimates for the probability that the sample results are representative of the population as a whole. • We will discuss more when we get to Inferential Statistics Dr. G. Johnson, www.ResearchDemsytified.org
Sample Results Can Also Have Non-sampling Errors • Even when people are randomly selected, not all will participate. This is called a “volunteer sample” and may be different in some ways that matter but can’t be known • Ideally, there is at least a 60% response rate to surveys, for example. Dr. G. Johnson, www.ResearchDemsytified.org
Sample Results Can Also Have Non-sampling Errors • Questions might have been written poorly. • Surveys did not go to the people best able to answer the questions • Eg. The survey was intended to be completed by executive directors but was completed by their assistants. Dr. G. Johnson, www.ResearchDemsytified.org
Handing Non-sampling Errors • Statistician cannot estimate the likely impacts of non-sampling errors. • Researchers will want to see if the demographics of the respondents are similar to the population as a whole. • Researchers might contact a small sample of the non-responders to see if their views are similar to what was reported by the respondents. • Researchers might look at other similar studies to see if their results are similar. Dr. G. Johnson, www.ResearchDemsytified.org
Handing Non-sampling Errors • Researchers should err on the side of caution when drawing firm conclusions based on sample data. • Limitations of sampling and non-sampling errors must be noted and conclusions must stay within those limitations. • Use weasel words: “it appears,” “the data suggests”, “the results are in the direction of our hypothesis,” “while not conclusive, it is likely” • Avoid definitive words and premature certainty Dr. G. Johnson, www.ResearchDemsytified.org
My Best Advice • Use the entire population whenever possible • If it is necessary to use a random sample, sample large • The calculated sample sizes should be seen as minimums • There is nothing more frustrating than getting to the end of a study to discover that the sample size was too small to give statistically valid results Dr. G. Johnson, www.ResearchDemsytified.org
Creative Commons • This powerpoint is meant to be used and shared with attribution • Please provide feedback • If you make changes, please share freely and send me a copy of changes: • Johnsong62@gmail.com • Visit www.creativecommons.org for more information Dr. G. Johnson, www.ResearchDemsytified.org