Download

1 / 11
180 likes | 469 Vues
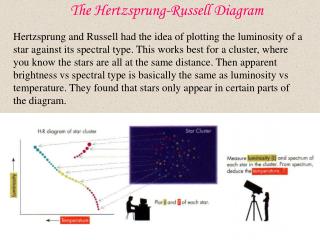
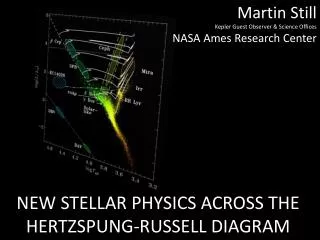
Learn about stars through the Hertzsprung-Russell Diagram showing relationships based on luminosity, temperature, and stages in a star's life. Discover why stars shine brightly or appear dim.

E N D
What is a star? • A cloud of gas, mainly hydrogen and helium • The core is so hot and dense that nuclear fusion can occur. • The fusion converts light elements into heavier ones
Every star is different • All the stars in the night sky are different • Brightness: • Tells us how luminous the star is, i.e. How much energy is being produced in the core • Color: • Tells us the surface temperature of the star
Units of luminosity • We measure the luminosity of every day objects in Watts. • How bright is a light bulb? • By comparison, the Sun outputs: • 380,000,000,000,000,000,000,000,000 Watts • (380 million million million million Watts!) • This is easier to right as 3.8 x 1026 Watts • To make things easier we measure the brightness of stars relative to the Sun.
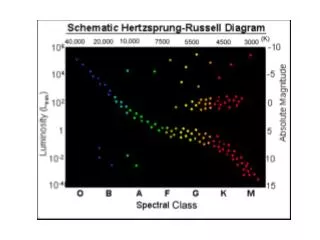
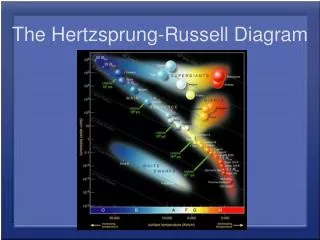
What is the HR Diagram? • Tool that shows relationships and differences between stars. • Relative measure of luminosity & temperature. • Shows stars of different ages/stages at the same time.
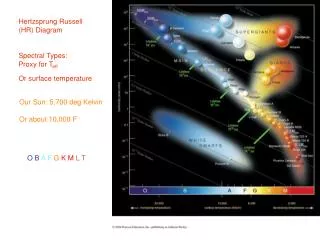
Measuring the temperature • The temperature of a star is indicated by its color • Blue stars are hot, and red stars are cold Red star Yellow star Blue star 3,000 K 5,000 K 10,000 K
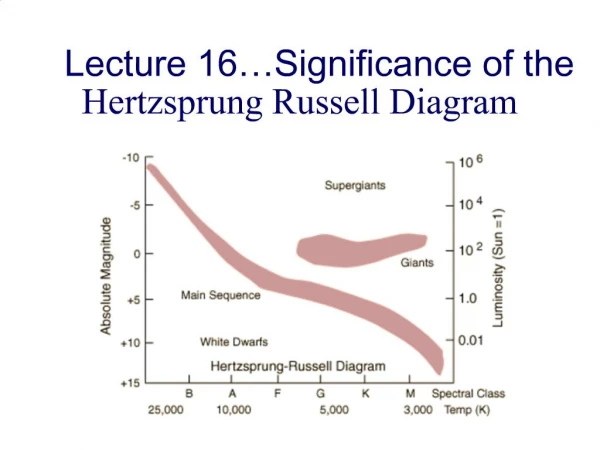
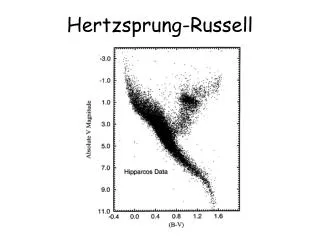
The Basics… • Each star is represented by a dot. • Vertical axis shows luminosity/absolute magnitude. • How much energy a star radiates in 1 sec. • How bright/dim a star appears, compared to Sun • Horizontal axis shows surface temperature (in K.) • NOTICE: Goes from high temps at left side to lower temps at right side!
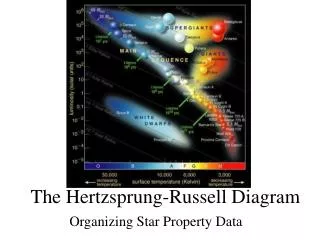
Types of Stars • Stars that fit the expected pattern – cool and dim; hot and bright – are called main sequence stars • Most stars fall in the region called main sequence. • Curved line sloping from top left to lower right of HR diagram.
Why is there a “main sequence”? • Usually there is a predictable relationship between brightness and temp. Hotter things are brighter Hotter temp = more energy is radiated. Bigger stars are brighter. Bigger surface area = more energy radiated.
Exception to the rule! • Some stars are cool but if they are massive enough, they can have high luminosity red giants or supergiants
Another Exception to the Rule • Some stars are very hot and shine intensely but are small so they don’t radiate much energy (appear dim) white dwarf stars