Download
1 / 17
170 likes | 312 Vues
Mean HIV viral load among resident cases and undiagnosed in Oregon. Jeff Capizzi, Epidemiologist Sean Schafer, HIV/STD/TB Medical Epidemiologist Lea Bush, Program Analyst HIV/STD/TB Program, Public Health Division 971-673-0182 Jeff.Capizzi@state.or.us

E N D
Mean HIV viral load among resident cases and undiagnosed in Oregon Jeff Capizzi, Epidemiologist Sean Schafer, HIV/STD/TB Medical Epidemiologist Lea Bush, Program Analyst HIV/STD/TB Program, Public Health Division 971-673-0182 Jeff.Capizzi@state.or.us HIV Data and Analysis: http://public.health.oregon.gov/DiseaseConditions/CommunicableDisease/DiseaseSurveillanceData/HIVData/Pages/Index.aspx
Presenter disclosure Jeffrey Capizzi The following personal financial relationships with commercial interests relevant to this presentation existed during the past 12 months: No relationships to disclose
Objectives of this presentation • Review methods and findings of a population viral load analysis in Oregon • Describe trends in Oregon diagnoses and viral loads • Estimate prevalence of people infected with HIV in Oregon (diagnosed and undiagnosed residents) • Describe undiagnosed residents with high viral loads • Describe diagnosed residents with high viral loads • Hypothesize reasons why the community viral load in Oregon may differ from other regions
Background • Decreases in HIV viral load associated with decreased transmission • Community Viral Load (CVL), a measure of transmission potential among those diagnosed (in/out of care) • Population Viral Load (PVL), a measure of both CVL and viral loads among those undiagnosed • Metrics include: • Mean Viral Load (MVL) • Proportion with suppressed viral load (≤200 copies/mL) • Proportion with high viral load (≥10,000 copies/mL)
Data used in the analysis • Oregon HIV/AIDS Reporting System (eHARS) • Residence updated from CD4/viral load test results and Oregon’s AIDS Drug Assistance Program data system • A comparison with Medical Monitoring Project random sample of HIV patients, suggested viral load reporting completeness at 96% and case reporting 98%
Methods Based on: Guidance on Community Viral Load: Measures, Definitions, and Methods for Calculation, CDC, August 2011 • MVL for undiagnosed residents • The number of people undiagnosed in Oregon was based on national estimates of the percent unaware of their HIV infection • The number estimated undiagnosed was then assigned the observed mean first viral load of Oregon diagnoses, 8/9/06–8/8/11 • MVL for diagnosed residents • Last viral load in previous 12 months • If missing, the last viral load in 18 months was used (n=374/5,582) • Cases without a viral load in 18 months, were assigned the mean first viral load among Oregon diagnoses (n=263/5,582)
Methods • Variables • Sex • Age • Race/ethnicity • Urban/Rural • Transmission category • HIV/AIDS status • Group differences • Geometric mean (z-score) • Percent clinically suppressed • Percent with high viral load
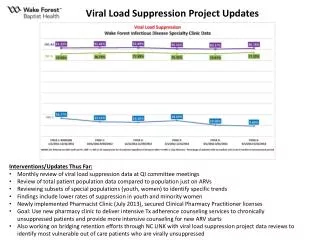
All CD4 / viral loads reportable Aug. 2006 HIV(notAIDS) reporting began Oct. 2001 • Diagnosis rate dropped from 8.5 to 6.2 cases/100,000 residents, 2003–2011 • Among all cases with viral loads reported in Oregon, 2007–10: • MVL decreased from 245 to 97 copies/mL • Clinical suppression increased from 67% to 80% • High VL decreased from, 19% to 9%
Viral load among undiagnosed residents • National estimates of the percentage unaware of infection were used to estimate the number of Oregon residents undiagnosed (Torian et al, MMWR June 3, 2011); (5,582 resident cases/(1 - 0.201) = 6,986 total infected, of which 1,404 were undiagnosed) • A MVL of 33,884 copies/mL per person was observed among 1,137 new diagnoses in Oregon, 8/9/2006–8/8/2011 • 1,404 undiagnosed residents had a MVL of 33,884 copies/mL • 73% had a MVL of ≥10,000 copies/mL
Residents not yet diagnosed in Oregon with higher MVL • Those who will be first diagnosed with AIDS vs. HIV(notAIDS) (74,131 vs. 16,982 copies/mL) • Males vs. females (38,018 vs. 15,848 copies/mL) • Males with unknown risk vs. MSM (75,857 vs. 36,307 copies/mL) • Male IDU had a MVL = 12,022 copies/mL • No statistical differences by age, race or region
CVL among resident living cases • 5,582 diagnosed residents had a MVL of 92 copies/mL • 80% had clinically suppressed viral load (≤200 copies/mL) • 10% had a MVL of ≥10,000 copies/mL
Living resident cases with higher MVL • HIV(notAIDS) status vs. AIDS (120 vs. 60 copies/mL) • 20-24 vs. 45-49 year olds (645 vs. 75 copies/mL) • African Americans vs. whites(169 vs. 85 copies/mL) • Male IDU & MSM/IDU vs. MSM (117 & 131 vs. 85 copies/mL) • Female IDU vs. heterosexual contact (204 vs. 93 copies/mL) • No statistical differences by sex or region
Population Viral Load • Population viral Load = (5,582 cases * 92 copies/mL) + (1,404 undiagnosed* 33,884 copies/mL) = 513,544 + 47,573,136 = 48,086,680 copies/mL • MVL among Oregon population = (48,086,680 copies/mL)/6,986 persons) = 6,883 copies/mL per person
Residents with high viral load • High viral loads • (≥10,000 copies/mL) • 73% of undiagnosed • 10% of diagnosed • 65% of high viral loadsamong undiagnosed
Conclusions • 65% of high viral loads among the undiagnosed • Higher MVLs in Oregon undiagnosed residents were among • Those who will be first diagnosed with AIDS • Males • Males with unknown risk • Higher MVLs in Oregon diagnosed residents were among • HIV(notAIDS) cases • Younger people • IDUs • African Americans
Why might Oregon’s viral load be lower than other jurisdictions? • The Oregon diagnosis rate is about half the national average of around 16 diagnoses/100,000 residents • Oregon’s ADAP covers insurance premiums so that almost all cases have access to ART • Long-term state-supported syringe exchange program • Living cases are mostly older MSM (64% MSM-only; mean age of all cases = 47 years) • Oregon’s low population density isolates sexual and IDU networks relative to other regions • Tiered case management system outside the Portland Metro Area uses Assoc. of Nurses in AIDS Care certified nurses to work with private medical providers and high acuity patients